Chromatography Theory, Part VIII: Pulling It All Together


Here, we explore how the different parameters in the Master Resolution Equation relate to Fs, and what that means for chromatographic experiments.
Throughout our discussion of chromatographic theory (1-7) we have emphasized the importance of Fs, the fraction of time an analyte spends stationary, as a key determiner of elution time and separation quality. Does the Master Resolution Equation make sense in light of this? Yes, but there is a lot of math involved. Here, we will explore how the different parameters in the Master Resolution Equation relate to Fs, and what that means for chromatographic experiments.
Review: For the Last Time
In previous columns (1-7), I have discussed and reviewed at length the concepts of elution time, capacity factor, separation factor, and plate number. The equation for elution time is shown in Equation 1:


where te is the elution time, to is the void time, and Fs is the fraction of time an analyte spends adsorbed on the stationary phase.
I introduced the Master Resolution Equation last time (1), which pulls together most of what we have learned about chromatography in one place. This is given as Equation 2:


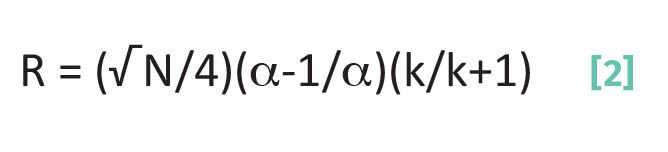
where R is resolution, N is the plate number, α is the separation factor, and k is the capacity factor.
To review very briefly, the parameters in Equation 2 are defined as follow.
Capacity factor, k:


where k is the capacity factor, te is the elution time, and t0 is the void time.
Separation factor, α:


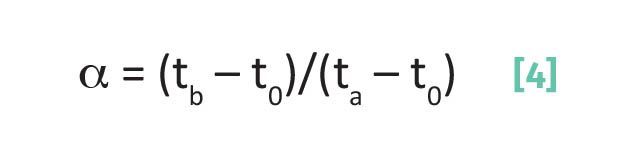
where α is the separation factor, tb is the retention time of peak b, ta is the retention time of peak a, t0 is the void time, and tb > ta.
Recall (4) that the separation factor is calculated for two peaks with elution times ta and tb whereby definition tb > ta.
Plate number, N:


where N is the plate number, te = elution time for a chromatographic peak, and w is the chromatographic peak width measured with the triangulation method.
Note that in Equations 3, 4, and 5 one or more elution times are present. In other words, each of the quantities in the Master Resolution Equation depends on elution time, and according to equation 1 elution time depends upon Fs. This means all the quantities in the Master Resolution Equation depend upon Fs.
For example, let’s take the first term in the Master Resolution Equation, (√N/4). If we rearrange Equation 5 to solve for te, and then substitute into equation 1 we obtain Equation 6.


where all these terms have been defined above.
Remember from the Master Resolution Equation (Equation 2) that N is proportional to R, and anything that increases N will increase chromatographic resolution. Peak width is in the denominator in Equation 6, which makes sense since as peaks get narrower N, and hence R, will get better. Note the presence of (1-Fs) in the denominator in Equation 6. As Fs goes up, (1-Fs) gets smaller, which means N, and hence R, get bigger.
This makes sense since the greater the fraction of time an analyte spends adsorbed the less chance it has to diffuse and broaden a peak and hence decrease resolution.
From Equation 2, we know that as k goes up R goes up. Equation 3 shows us the dependence of capacity factor on elution time te. Recall (5) that the elution time, te, is related to Fs as shown in Equation 7a.


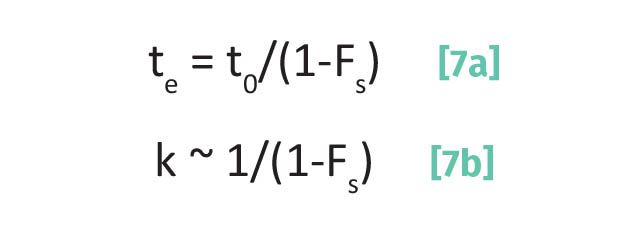
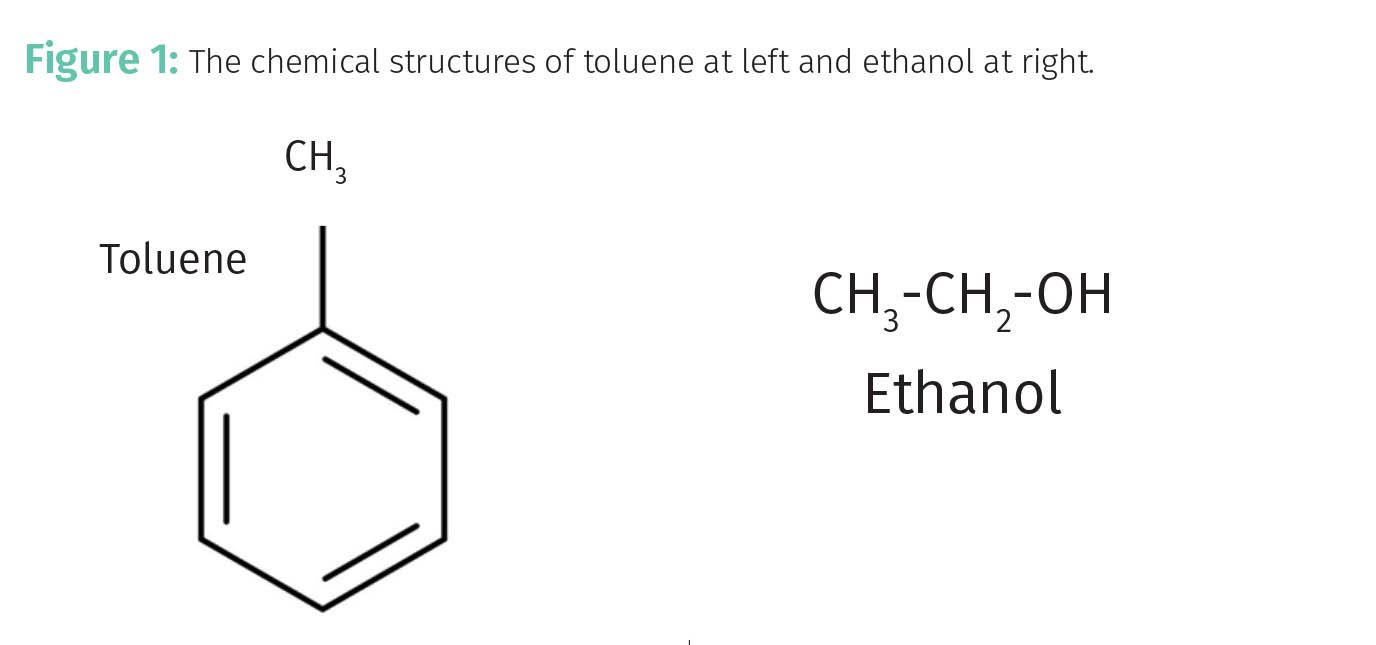
If we substitute Equation 1 into Equation 3 and rearrange we obtain Equation 7b. The ~ in Equation 7b means the two quantities are proportional. Note in Equation 7b that (1-Fs) is in the denominator again as in Equation 6. Again, this means that as Fs goes up, k goes up. The capacity factor k depends upon the elution time, te. The elution time is determined, in part, by the affinity of an analyte for the stationary phase. There is a maxim in chemistry when thinking about solutions that “likes dissolve likes.” Similarly in chromatography, “likes adsorb likes.” Consider the structures of ethanol and toluene seen in Figure 1. A polar ethanol molecule with an O-H group is much more likely to adsorb onto a silica stationary phase containing Si-OH groups than a non-polar toluene molecule. In this case, Fs for ethanol will be greater than for toluene, toluene will elute before ethanol, and k for ethanol will be greater than that for toluene. This term “affinity” of the analyte for the stationary phase can be thought of as its “stickiness.” Sticky analytes will bind more strongly to the stationary phase and thus spend a greater fraction of their time adsorbed than less sticky ones.


For the separation factor α, if we substitute Equation 1 into Equation 4 we derive Equation 8.


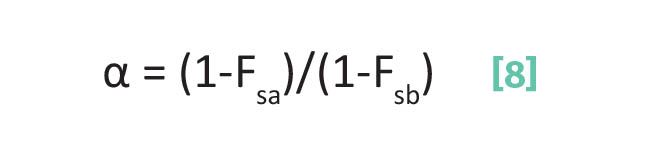
where α is the separation factor, Fsa is the fraction of time analyte a spends adsorbed on the stationary phase, and Fsb is the fraction of time analyte b spends adsorbed on the stationary phase.
Note that Equation 8 involves the ratio Fsa to Fsb, the fractions of time analytes a and b spend adsorbed on the stationary phase.
From Equation 2, note that as α goes up R goes up. Does this make sense? To maximize α and hence R, in Equation 8 we want the numerator to be as large as possible, and the denominator to be as small as possible. To maximize the numerator, we want Fsa to be small so (1- Fsa) is large; that is, we want analyte a to spend as small a fraction of its time stationary as possible and hence elute as early as possible. Whereas to minimize the denominator, we want Fsb large so (1-Fsb) is small, which means we want analyte b to spend as large a fraction of time as possible on the stationary phase so it elutes as late as possible. This all makes sense because the larger the difference between Fsa and Fsb the greater the difference in their speeds through the column and the greater the difference in their elution times. This will maximize R.
Real World Use of the Master Resolution Equation
Now that we have discussed the Master Resolution Equation and its components in detail, how do we make use of this knowledge to optimize chromatographic separations?
Let’s begin with the first term involving plate number, N. Recall (5,6) that N is a measure of the number of times an analyte molecule adsorbs as it works its way down a chromatographic column. So, how do we increase the number of sites a molecule can adsorb on? One way is to increase the column length; the longer the column the more adsorption sites there are and hence the more chances an analyte molecule has to adsorb. Column length is a variable used often in gas chromatography (GC) to optimize separations. For example, there are GC columns available in lengths from 15 to 60 m (8). In high performance liquid chromatography (HPLC) columns of different length are also available, for example from 50 to 300 mm (11). So, when developing a chromatographic method it makes sense to have columns of different length available as it is easy enough to swap out chromatographic columns to change column length and hence N. However, a disadvantage of increasing column length is that it increases analysis time; the longer the column, the more time it will take an analyte molecule to travel its length for a given flow rate. Another problem with increasing column length is increased backpressure, which can put a strain on HPLC pumps.
A second way of increasing N is to reduce the particle size of the packing material. Small particles have a greater surface area than large particles, which means they have more adsorption sites available compared to large particles. Increasing the number of adsorption sites gives molecules more places to adsorb, increasing N. Thus, both GC and HPLC columns can be purchased with different particle sizes varying from a few microns (µm) to 100 µm or more (8,10). Like increasing column length, a disadvantage of decreasing particle size is increasing backpressure.
The second term in the Master Resolution Equation involves the separation factor, α. Recall from the discussion above that α is calculated for a pair of chromatographic peaks. One of the most convenient variables we can change to alter the chemistry of a separation is the polarity of the mobile and stationary phases. In HPLC (10), what is known as “normal phase” chromatography involves a polar stationary phase and non-polar solvent. Whereas in “reversed phase” chromatography (10) a non-polar stationary phase and polar solvent are used.
Let’s imagine that we want to separate a mixture of toluene and ethanol. Again, their respective chemical structures are seen in Figure 1. As noted above, because of their chemical structures ethanol is more polar than toluene.
For a normal phase HPLC separation of these analytes we could use a polar silica stationary phase containing Si-OH groups and a non-polar mobile phase such as hexane. In this case, the non-polar toluene will have a low affinity for the polar stationary phase, Fs for it will be small, and it will elute early. On the other hand the polar ethanol will have a high affinity for the polar stationary phase, it's Fs will be large, and it will elute late.
Reversed-phase chromatography is sometimes performed with silica particles that have been covered with a hydrocarbon coating such as “C18” (CH3–(CH2)16-CH3) (10,11), providing non-polar adsorption sites, and a polar mobile phase such as water. In this case, polar ethanol will have a low affinity for the stationary phase, its Fs will be small, and it will elute first. On the other hand the non-polar toluene will have a low affinity for the mobile phase, a high affinity for the stationary phase, its Fs will be large, and toluene will elute later.
In summary, changing the nature of the column packing or mobile phase impacts the separation factor and hence can be used to optimize a separation. Note in the above example, that the elution order and elution times for the same two analytes differed greatly depending upon the experimental conditions. That is, elution time is not just a function of the chemical structure of the analyte but also the nature of the stationary and mobile phases as well. This means that elution times are not unique for a given molecule and should not be used for chemical identification, more on that later.
Pulling it All Together
To summarize, to optimize a separation we can experiment with the variables in the Master Resolution Equation as such:
- The plate number, N, can be increased by increasing column length or reducing stationary phase particle size.
- The separation factor, α, can be optimized by changing the type of mobile phase or stationary phase. For example, the polarity of the two phases can be changed to effect a separation.
- The capacity factor, k, can be optimized, for example, by changing the composition of the mobile phase.
Equation 2, the Master Resolution Equation, tells us that the quality of a chromatographic separation depends upon N, a, and k. Equations 6-8 show us that all these parameters are related to Fs, the fraction of time an analyte molecule spends stationary. This is because Fs determines the speed at which a molecule moves through a chromatographic column, and at the end of the day this is what determines elution time. Thus, all of the experimental parameters we have discussed here that can be varied are all done simply to get Fs to be different enough for the analytes in a mixture that their retention times are different enough to achieve baseline resolution. This is your mission as a chromatographer, if you choose to accept it.
In future columns I will use these concepts to help us understand different types of chromatography, including a detailed analysis of my favorite cannabis potency liquid chromatography method (11).
Conclusions
We reviewed concepts previously developed for capacity factor, separation factor, and plate number. I then presented the Master Resolution equation, that shows that to optimize a chromatographic separation we want N, α, and k to be maximized. We saw that all of these parameters depend upon Fs in some form. We then discussed how to vary a number of chromatographic experimental variables to maximize R.
References
- Smith, B., Chromatographic Theory, Part VII: The Master Chromatographic Resolution Equation, Cannabis Science and Technology, 2023, 6(6), 7-11.
- Smith, B., Chromatographic Theory, Part VI: Peak Widths, Band Spreading, and Plate Number, Cannabis Science and Technology, 2023, 6(5), 6-9.
- Smith, B., Chromatographic Theory, Part V: Chromatographic Resolution, Cannabis Science and Technology, 2023, 6(4), 8-11.
- Smith, B., Chromatographic Theory, Part IV: Measuring Separation Quality with Capacity and Separation Factors, Cannabis Science and Technology, 2023, 6(3), 8-11.
- Smith, B., Chromatography Theory, Part III: Calculating Elution Times and Capacity Factors, Cannabis Science and Technology, 2023, 6(2), 8-11.
- Smith, B., Chromatography Theory, Part II: How Separations Occur Illustrated and Quantitated, Cannabis Science and Technology, 2023, 6(1), 7-12.
- Smith, B., Principles of Chromatography, Part I: Theory, Cannabis Science and Technology, 2022, 5(9), 8-11.
- Carlin, M., and Dean, J., Forensic Applications of Gas Chromatography, CRC Press, 2013.
- Smith, B., Quantitation of Cannabinoids in Dried Ground Hemp by Mid-Infrared Spectroscopy, Cannabis Science and Technology, 2019, 2(6), 28-33.
- Bayne, S., and Carlin, M., Forensic Applications of High Performance Liquid Chromatography, CRC Press, 2010.
- Giese, M., Lewis, M., Giese, L., and Smith, K., J. AOAC Int., 2015, 98(6)1503.
About the Columnist


Brian C. Smith, PhD, is Founder, CEO, and Chief Technical Officer of Big Sur Scientific. He is the inventor of the BSS series of patented mid-infrared based cannabis analyzers. Dr. Smith has done pioneering research and published numerous peer-reviewed papers on the application of mid-infrared spectroscopy to cannabis analysis, and sits on the editorial board of Cannabis Science and Technology. He has worked as a laboratory director for a cannabis extractor, as an analytical chemist for Waters Associates and PerkinElmer, and as an analytical instrument salesperson. He has more than 30 years of experience in chemical analysis and has written three books on the subject. Dr. Smith earned his PhD on physical chemistry from Dartmouth College.
Direct correspondence to: brian@bigsurscientific.com.
How to Cite this Article
Smith, B., Chromatography Theory, Part VIII: Pulling It All Together, Cannabis Science and Technology, 2023, 6(7), 6-10.


Mass Spectroscopy Primer, Part II: Data Interpretation
May 6th 2025Part II of this series on mass spectroscopy explains how mass spectral data is interpreted to determine molecular weight, molecular formulas, molecular structures, and functional group information. Two examples are provided to illustrate the process mass spectroscopists use to draw conclusions.


