Inter-Laboratory Variation in Cannabis Analysis: Pesticides and Potency in Distillates
Cannabis distillate samples spiked with known amounts of pesticides were submitted to five cannabis testing laboratories-here are the results.
Table I (click to enlarge): Quantity of pesticide spiked into cannabis distillate samples and California state action limits
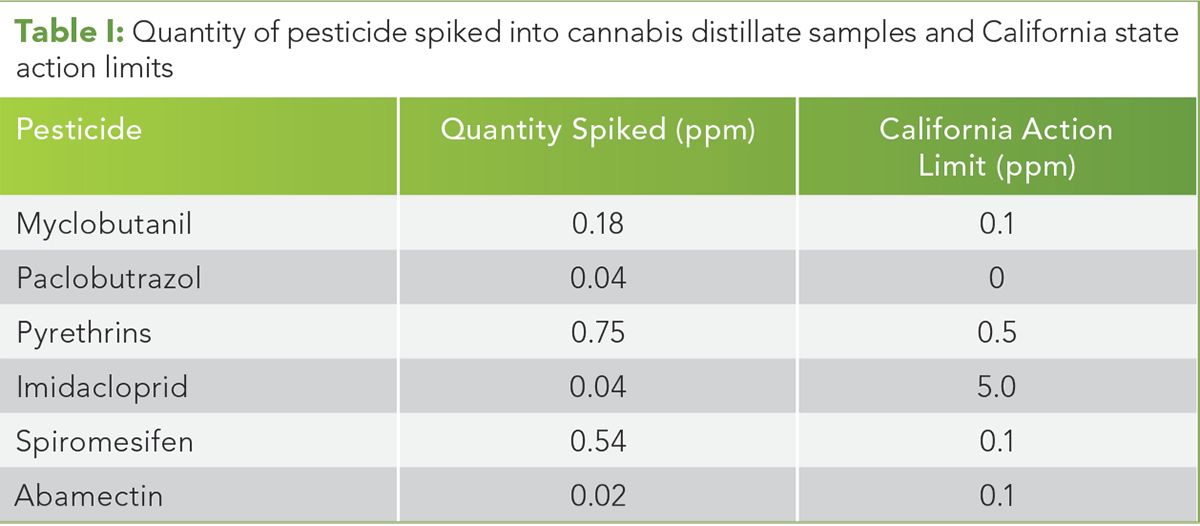
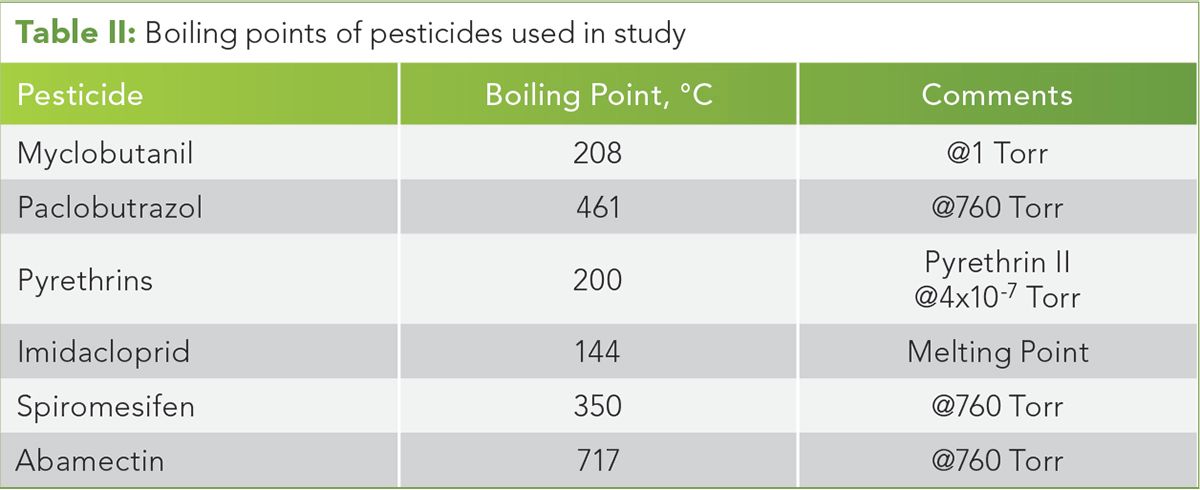
Table II (click to enlarge): Boiling points of pesticides used in study
Cannabis distillate samples spiked with known amounts of pesticides were submitted to five cannabis testing laboratories. The false positive rate for pesticide detection was zero percent (%), but the false negative rate was 78%, indicating contaminated material may be reaching cannabis patients and users. Distillate samples were also analyzed for potency. The Δ9-tetrahydrocannabinol (THC) concentration values obtained varied from 77% to 94% with a 95% confidence limit of 8.08%, an unacceptably large error given the high concentration of the target analyte. Potency measurements on this material using mid-infrared (IR) spectroscopy gave a THC weight percent range from 89% to 93%, and a 95% confidence interval of 2.3%, 3.5x more precise than the cannabis laboratories. The consistent mid-IR results indicate the sample was homogeneous. The scatter observed in pesticide and potency results from the laboratories means inter-laboratory variation is a problem in the cannabis industry. Potential causes and solutions to the problem are discussed.
The problem of inter-laboratory variation in the cannabis testing industry, that is, different laboratories obtaining statistically different results on the same samples, is ongoing (1–3). One study (1) found most of the cannabidiol (CBD) oil samples analyzed were labeled with incorrect potencies. Reports in the popular media (2,3) have documented similar problems. We investigated inter-laboratory variation in our area (central California), and chose distillates because they are relatively high purity homogeneous liquids that should be easy to analyze.
We investigated pesticide contamination variability because one laboratory will pass and another fail the same sample. This conflicting data makes it difficult for cannabis businesses to ensure quality control and make decisions regarding material status. We submitted a set of cannabis distillate samples from the same batch known to be pesticide free (control), and a set of samples from the same batch spiked with known amounts of six pesticides (myclobutanil, paclobutrazol, pyrethrin, imidacloprid, spiromesifen, and abamectin). The samples were submitted to five different cannabis laboratories in the central California area to study the phenomenon of inter-laboratory variation.
We were also concerned about distillate potency inter-laboratory variation. Our experience has been that cannabis laboratories obtain markedly different Δ9-tetrahydrocannabinol (THC) values on the same sample. Traditionally, high performance liquid chromatography (HPLC) has been used to measure cannabinoid profiles in cannabis-containing materials (4–6). More recently, mid-infrared (IR) spectroscopy has been used to determine cannabinoid concentrations in cannabis oils and extracts (7,8). In this study, we extend the use of mid-IR to the analysis of potency in cannabis distillates. We found that mid-IR potency measurements gave better precision than HPLC. We believe this is because of the lack of sample preparation required for mid-IR. The results of all laboratory tests were collated, tabulated, and are presented below. Further explanations and possible solutions to the inter-laboratory variation problem are discussed.
Experimental
Pesticide and Potency Samples
To start, 60 g of a cannabis distillate batch made by the Herer Group were used. This distillate was found to be pesticide free by two different cannabis analysis laboratories. Next, 30 g of the distillate were set aside as a control. The second 30 g were spiked with known amounts of the pesticides listed in Table I, and compared to the state of California pesticide action limits (9). (See upper right for Table I, click to enlarge.)
Spiked samples were prepared by weighing commercial pesticides on an analytical balance, taking into account the concentration of pesticides in each product to determine the appropriate amount to measure. These quantities were dissolved in 100 mL ethanol to make a concentrated pesticide stock solution. Then 1 mL of concentrated solution was mixed with 1 L of ethanol to create a dilute pesticide solution. A blank sample of the ethanol was tested and found to be pesticide free.
Next, 300 mL of dilute pesticide solution were used to dissolve 30 g of distillate known to be pesticide free. Ethanol was removed using a rotovap whose water bath was heated to 40 °C. The solution was heated for 30 min at 50 Torr pressure. The boiling points of the spiked pesticides are listed in Table II. (See upper right for Table II, click to enlarge.)
Given the high boiling points of the six pesticides, and the gentle evaporation conditions used, little or no pesticide should have been lost. Regardless, the sample was small enough that any pesticide evaporation would have been uniform throughout the material, and all the laboratories should have obtained the same results. All samples were prepared at the same time by the same person, were always in his custody, and were hand delivered to the laboratories by him the day after preparation. This means there was no chance for the samples to change composition because of aging or tampering.
Two samples of spiked distillate and two samples of pesticide-free distillate were submitted to each laboratory. Five labs were used, each received four samples, so a total of 20 pesticide panels and cannabinoid profiles were measured. There were 10 pesticide free and 10 pesticide-spiked samples, the latter of which contained six different pesticides. A total of 60 potential pesticide detection events or hits were possible.
Our samples were analyzed for the presence of the 66 pesticides currently regulated by the state of California (9). The experimental methods for pesticide and potency measurements were laboratory dependent and their details were not made available to us. Typically, gas chromatography–tandem mass spectrometry (GC–MS/MS) or liquid chromatography–tandem mass spectrometry (LC–MS/MS) techniques are used to measure pesticides in cannabis-containing materials (10–13). HPLC is typically used for cannabis potency measurements (4–6).
Table III (click to enlarge): Mid-IR THC in distillate calibration metrics

Figure 1 (click to enlarge): A plot of THC concentration (wt.%) in cannabis distillates as determined by HPLC versus as measured by mid-IR.
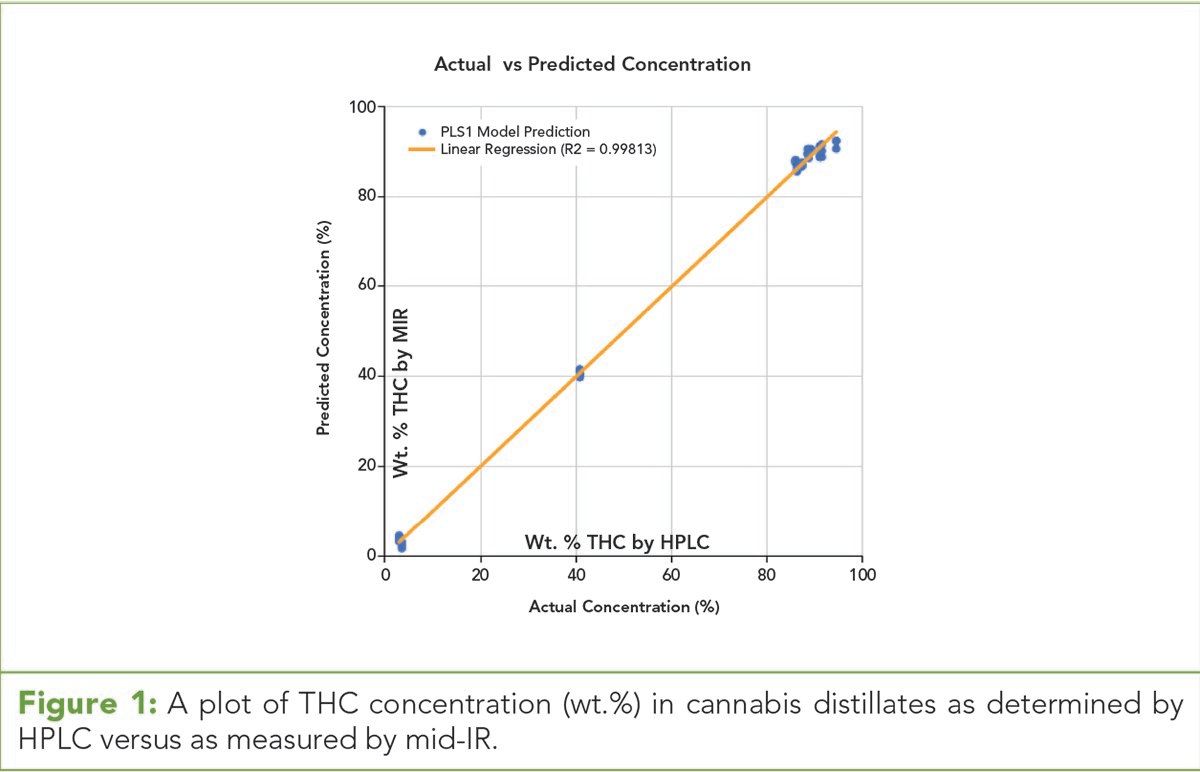
Table IV (click to enlarge): Results of round-robin study of pesticide spiked cannabis distillate*

Mid-IR Potency Method Calibration and Validation
The BSS 2000 Cannabis Analyzer from Big Sur Scientific was used to measure distillate potency. It contains a mid-IR spectrometer that was scanned from 1250 to 952 cm-1 at 12 cm-1 spectral resolution. A zinc selenide (ZnSe) attenuated total reflectance (ATR) crystal was used. The ATR sampling technique was chosen since it requires minimal sample preparation and cleanup. Distillate samples were placed onto the ZnSe window, scanned, and the window was cleaned afterwards with ethanol and a paper towel. Mid-IR methods to quantitate Δ9-THC, Δ8-THC, tetrahydrocannabinolic acid (THCA), cannabidiol (CBD), cannabidiolic acid (CBDA), cannabigerol (CBG), cannabinol (CBN), cannabichromene (CBC), and tetrahydrocannabivarin (THCV) in cannabis distillates were developed. Details on this work will be published elsewhere (14). This paper focuses on using mid-IR to specifically measure Δ9-THC in cannabis distillates.
Mid-IR calibration models were constructed by measuring IR spectra of 11 distillate batches in triplicate for a total of 33 spectra. The same samples were analyzed for potency via HPLC by CW Analytical. The measured spectra and the cannabis laboratory reference values were input to a partial least squares regression (PLS1) algorithm, and models were constructed using Big Sur Scientific’s Model Builder software. Calibration metrics for the mid-IR THC in distillates calibration are shown in Table III. (See upper right for Table III, click to enlarge.)
To determine the quality of the mid-IR calibration, a plot of THC concentration measured on a calibration sample set by mid-IR and HPLC was constructed (Figure 1). (See upper right for Figure 1, click to enlarge.)
The correlation of any two data sets can be determined by calculating the correlation coefficient (R2) for plots like that in Figure 1. Perfect agreement yields a straight line passing through the center of each data point and an R2 value of 1.0. Experimental error prevents this. Correlation coefficients of 0.99 or better are possible for spectroscopic calibrations and are considered excellent (15). Figure 1 shows an R2 value of 0.998, indicating the mid-IR THC in distillate measurements agree well with HPLC. Table III shows that the range of the THC calibration is 3 to 94 wt.%, a factor of 30 between the lowest and highest values. A spectroscopic calibration performing well over such a broad range is unusual (15) and indicates that mid-IR gives good results over a broad THC range.
The mid-IR THC calibration was validated using a set of six distillate samples whose cannabinoid weight percents were measured by HPLC, but whose data were not included in the calibration. The PLS1 model was applied to the validation set spectra, weight percents THC were predicted, and compared to those determined by HPLC. The standard error of prediction (SEP) is the standard deviation of the known and predicted weight percents for a validation sample set (15). SEP measures how well a calibration performs on unknown samples. The SEP for THC listed in Table III is 1.26 wt.%, indicating that mid-IR can accurately determine THC levels in cannabis distillates.
Results and Discussion
Cannabis Laboratories Round-Robin Pesticide Results
The five laboratories were randomly designated as V, W, X, Y, and Z. The two spiked pesticide samples received by each laboratory were designated V1, V2, W1, W2, and so forth. For the pesticide free samples, all laboratories successfully reported no pesticides detected for a false positive rate of 0%. The results for the samples spiked with pesticides were quite different and are seen in Table IV. (See upper right for Table IV, click to enlarge.)
Myclobutanil was present above the California action limit, but was only detected in five of the 10 samples analyzed. Two of the laboratories missed it completely. When detected, the myclobutanil concentrations agree reasonably well with the spiked value of 0.18 ppm. Paclobutrazol is not allowed in any detectable amount by the state of California (9). All the laboratories missed the presence of this pesticide, even though it was above the limit of detection (LOD) claimed by the laboratories. Pyrethrin was spiked in an amount well above the state limit. Only one of the labs detected it, and the values obtained are 4x less than the actual amount present.
Imidacloprid was present below the action limit, but above the LODs stated by the laboratories. Four of the labs completely missed it, with Lab X being the only one to detect its presence, albeit at twice the actual value. Spiromesifen was present in greater than five times the action limit, but three of the laboratories missed it. The laboratories that detected it agreed reasonably well with the amount present. Abamectin was present below the action limit, but near the LODs listed by the laboratories. None of the laboratories detected its presence.
The results in Table IV are disturbing. Laboratories V and Z found no pesticides in the spiked samples even though some of them were well above their action limits. Laboratory W found pesticides in one out of 12 possible hits, while laboratory Y only found two out of the six pesticides present. Lab X did the best, detecting four pesticides in each of the samples they received, but still completely missing two of them. There were 10 spiked samples for a total of 60 possible pesticide hits. Only 13 were recorded, giving a false negative rate of 47/60 or 78%. Even when the presence of a pesticide was correctly detected, the measured concentrations agreement with the actual numbers varied by pesticide. These results mean laboratories are missing contaminated material, which may be entering the marketplace and potentially threatening the health of cannabis patients and users.
Table V (click to enlarge): Results of round-robin study of THC in same distillate batch

Table VI (click to enlarge): Statistics for 20 HPLC THC readings
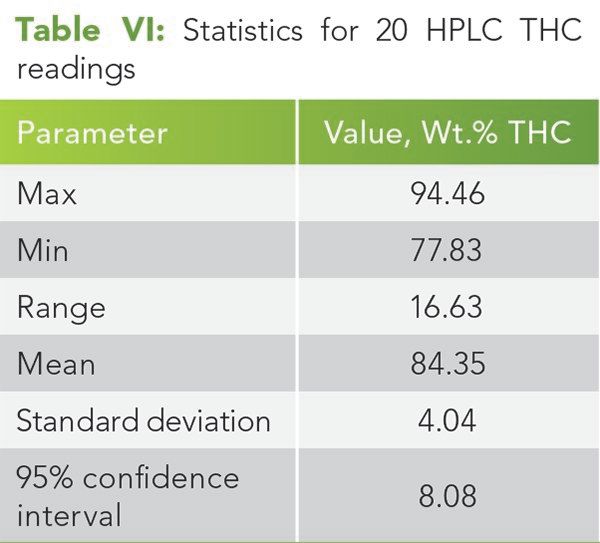
Table VII (click to enlarge): Average THC content and standard deviations for the same batch analyzed by five laboratories
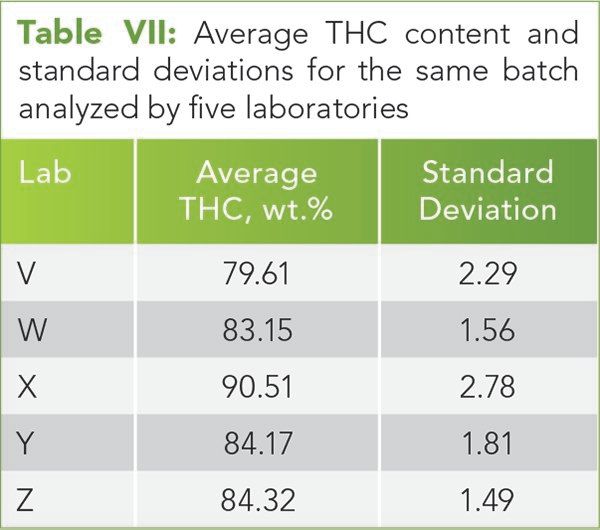
Figure 2 (click to enlarge): Histogram of cannabis laboratory THC values as measured by HPLC.
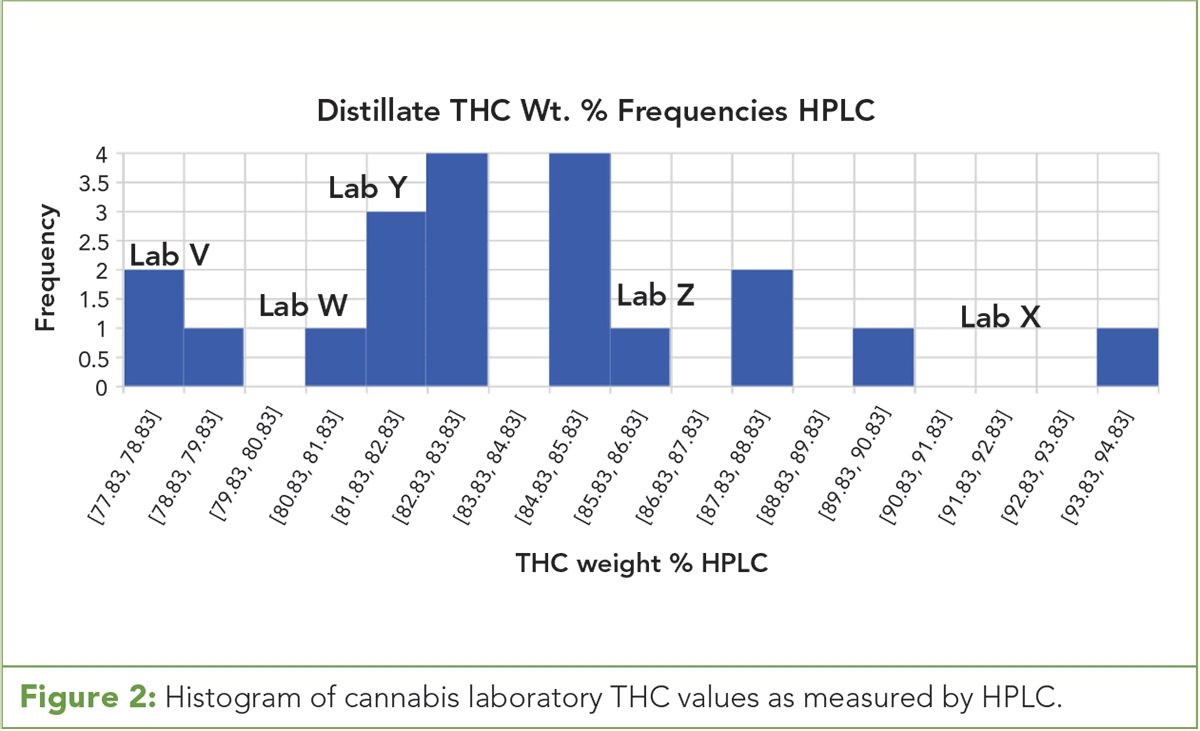
Table VIII (click to enlarge): THC concentrations (Wt.%) of distillate batch measured by mid-IR: raw values

Table IX (click to enlarge): Summary statistics for 20 mid-IR THC readings
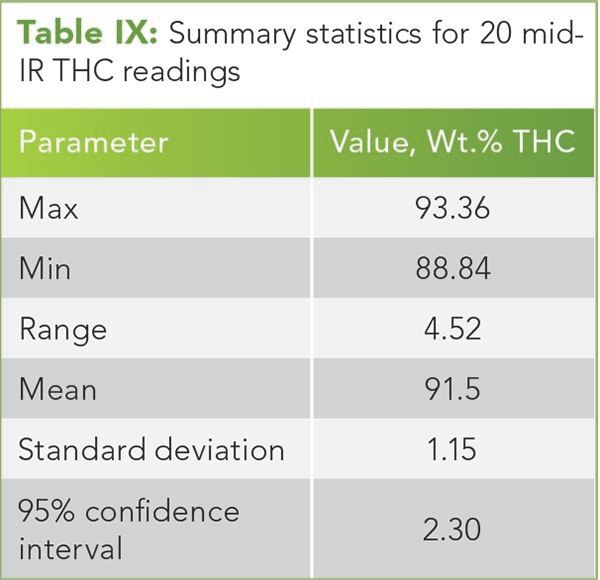
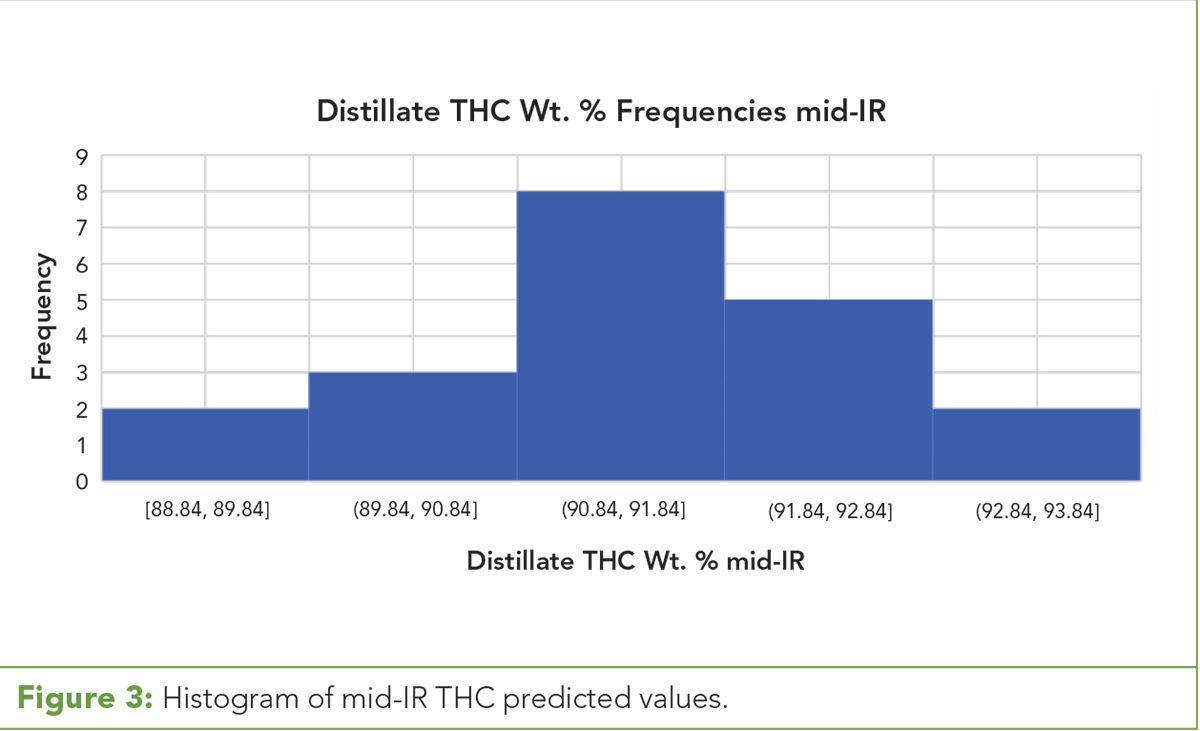
Figure 3 (click to enlarge): Histogram of mid-IR THC predicted values.
Cannabis Laboratories Round-Robin Distillate Potency Results
Each of the five labs received four samples of the same distillate batch and were asked to measure cannabinoid profiles. A total of 20 THC values on the same distillate batch were measured. The results are shown in Table V. (See upper right for Table V, click to enlarge.)
The statistics for these 20 readings are shown in Table VI. (See upper right for Table VI, click to enlarge.)
The range of measured THC concentrations varied from 77.83% to 94.46%, a range of over 16 wt.%. The standard deviation of the HPLC measurements is 4.04 wt.% THC. A measure of dataset accuracy is the 95% confidence interval, which is approximately twice the standard deviation (15). The 95% confidence interval for the HPLC THC data is 8.08 wt.%. This level of imprecision is unacceptable and makes it difficult for cannabis businesses to make decisions and meet label claims. A recent article (16) showed that many cannabis compliance samples are failing in California because of false label claims. Given the inter-laboratory variation seen in our data, the problem may not be with the samples but with the testing results.
The average and standard deviation of the four THC readings obtained by each laboratory are shown in Table VII. (See upper right for Table VII, click to enlarge.)
The standard deviation in each laboratory’s set of potency values is on the order of 2 wt.%. This indicates each laboratory’s method is precise, but not necessarily accurate (for a discussion of the difference between these two metrics see reference 17). However, the laboratories quote a precision of better than 1 wt.%, so these results are still disturbing.
Figure 2 shows a histogram of the 20 potency values obtained by the cannabis laboratories via HPLC. (See upper right for Figure 2, click to enlarge.) If random error were the true cause of inter-laboratory variation, this would be a Gaussian distribution (15). Instead, each laboratory’s values form clusters, and the clusters are separated from each other. This indicates that systematic error may be the cause of the inter-laboratory variation seen in potency values.
A possible cause of inter-laboratory variation for pesticide and potency measurements is differences in sample preparation. It has been our observation that cannabis laboratories use different solvents, solvent quantities, dissolution, agitation, and dissolution schemes when preparing cannabis samples. This is because there is no standardized test or protocol required by the California Bureau of Cannabis Control.
It is possible differences in sample preparation and cleanup methods result in analyte extraction from cannabis samples with varying degrees of efficiency. If each laboratory has a different extraction efficiency, a histogram of the measured values would show each laboratory’s readings clumped together and separated from each other. This is seen in Figure 2, indicating that extraction efficiency plays a part in inter-laboratory variation.
A laboratory may have a linear calibration for their chromatograph from the use of pure standards of known concentration for calibration. This indicates the instrument works well on purified samples, but says little about sample extraction efficiency. Until cannabis standard reference materials are available, obtaining a reproducible sample extraction method may remain elusive.
Comparison to Mid-IR Potency Results
The potency of the same distillate batch measured by HPLC was also measured 20 times by mid-IR. The values obtained are shown in Table VIII. (See upper right for Table VIII, click to enlarge.)
The statistics for this dataset are shown in Table IX. (See upper right for Table IX, click to enlarge.)
The mid-IR results in Table IX should be compared to the HPLC results in Table VI. Note that the mid-IR range is 4.52 wt.% THC, which is much less than the 16 wt.% range obtained by HPLC. The 95% confidence interval obtained by mid-IR is 2.3 wt.% THC, 3.5 times lower than what was obtained with HPLC. This indicates mid-IR is more precise than HPLC at measuring cannabis distillate potencies. Additionally, the precision of the mid-IR potency readings indicates the distillate sample was homogeneous.
Figure 3 shows a histogram of the 20 cannabis distillate THC values measured by mid-IR. (See upper right for Figure 3, click to enlarge.) These data follow an approximately Gaussian distribution, indicating the main error source in these measurements is random rather than systematic (15). These results also indicate that mid-IR has less systematic error than HPLC.
In this study, HPLC is the primary method and mid-IR is a secondary method for measuring potencies. In general, the accuracy of secondary IR spectroscopic methods is 1.5x to 2x larger than the primary method (15). However, in the context of cannabis distillate potency measurements there is no “true value” as a basis of comparison for accuracy calculations because cannabis distillate standard reference materials do not exist. Thus, we cannot determine the accuracy of either the mid-IR or HPLC methods. What we can compare is precision by seeing how reproducible HPLC and mid-IR potency readings are on the same sample. As seen above, the precision of the mid-IR method is 3.5x greater than the HPLC method. Since precise readings are needed by cannabis businesses to make decisions, this indicates that mid-IR may be a better choice than HPLC for research and development (R&D), in-house process monitoring, and process control measurements for the cannabis industry. Additionally, given the variation in potency readings across the five laboratories, an orthogonal potency method might be useful as a check on each laboratory’s results. Mid-IR is a candidate for this method.
Conclusions
Samples were submitted to five cannabis laboratories for pesticide panels and cannabinoid profiles. The false positive rate for pesticides was 0% and the false negative rate was 78%, indicating that these laboratories are falsely passing pesticide-laden material.
The THC values returned by these laboratories measured by HPLC for the same sample batch gave a range of greater than 16 wt.% and a 95% confidence interval of 8.08 wt.%. Mid-IR potency measurements on the same batch produced a range of 4.52 wt.% THC and a 95% confidence interval of 2.15 wt.%, 3.5 times lower than observed by HPLC. This indicates that the mid-IR method is more precise at measuring cannabis distillate potency than HPLC.
Histograms of the HPLC and mid-IR potency measurements showed significant systematic error in the HPLC measurements, and little systematic error in the mid-IR measurements. This may be explained by observed differences in sample preparation methods across laboratories, which may result in varying extraction efficiencies, giving the inter-laboratory variation observed. This problem will probably persist until standard cannabis reference materials become available, and the appropriate authorities promulgate standard analysis methods. The variation in potency values indicates cannabis analysis laboratories should consider an orthogonal method to HPLC such as mid-IR to monitor the quality of their results.
References:
M.O. Bonn-Miller, M.J. E. Loflin, B.F. Thomas, J.P. Marcu, T. Hyke, and R. Vandrey, JAMA, J. Am. Med. Assoc. 318, 1708 (2017).
- B. Young, The Seattle Times, January 5, 2016. https://www.seattletimes.com/seattle-news/marijuana/some-pot-labs-in-state-failed-no-pot-at-all-says-scientist/.
- https://www.nbcbayarea.com/investigations/Industry-Insiders-Warn-of-Fraud-at-Marijuana-Testing-Labs-458125743.html?_osource=SocialFlowFB_BAYBrand.
- A. Hazekamp, A. Peltenburg, R. Verpoorte, and C. Giroud, J. Liq. Chromatogr. Relat. Technol. 28, 2361 (2005).
- B. De Backer, B. Debrus, P. Lebrun, L. Theunis, N. Dubois, L. Decock, A Verstraete, P. Hubert, and C. Charlier, J. Chromatogr. B: Biomed. Sci. Appl. 877, 4115 (2009).
- M. Giese, M. Lewis, L. Giese, and K. Smith, J. AOAC Intl. 98, 1503 (2015).
- B.C. Smith, Terpenes & Testing Magazine Nov/Dec(6), 48–51 (2017).
- B.C. Smith, Terpenes & Testing Magazine Jan/Feb(7), 34–40 (2018).
- California Bureau of Cannabis Control Regulations, Section 5719.
- J. Konschnik, H. Krug, and S. Kassner, Cannabis Science and Technology 1(1), 42–47 (2018).
- K. Stenerson and G. Oden, Cannabis Science and Technology 1(1), 48–53 (2018).
- R. Jordan, L. Asanuma, D. Miller, and A. Maherone, Cannabis Science and Technology 1(2), 26–31 (2018).
- A. Dalmia, E. Cudjoe, T. Astill, J. Jalali, J. Weisenseel, F. Qin, M. Murphu, and T. Ruthenberg, Cannabis Science and Technology 1(3), 38–50 (2018).
- B.C. Smith and P. Lessard, manuscript in preparation.
- B.C. Smith, Quantitative Spectroscopy: Theory and Practice (Elsevier, Boston, Massachusetts, 2002).
- B. Staggs, The Orange County Register, July 26, 2018. https://www.ocregister.com/2018/07/26/first-tests-are-in-and-one-in-five-marijuana-samples-in-ca-isnt-making-grade/.
- B.C. Smith, Cannabis Science and Technology 1(4), 12–16 (2018).
Brian C. Smith, PhD, is the Lab Director, Paul Lessard PhD, is the Chief Scientific Officer, and Rich Pearson is a Senior Scientist at the Herer Research Institute in Santa Cruz, California. Direct correspondence to: briansmith@herergroup.com
How to Cite This Article
B.C. Smith, P. Lessard, and R. Pearson, Cannabis Science and Technology 2(1), 48-53 (2019).
