Cannabis Uncertainty
This article is intended to spark conversations about measurement uncertainty that lead to the recognition and application of effective uncertainty budgets in the cannabis arena.
Ky Camacho/Shutterstock.com

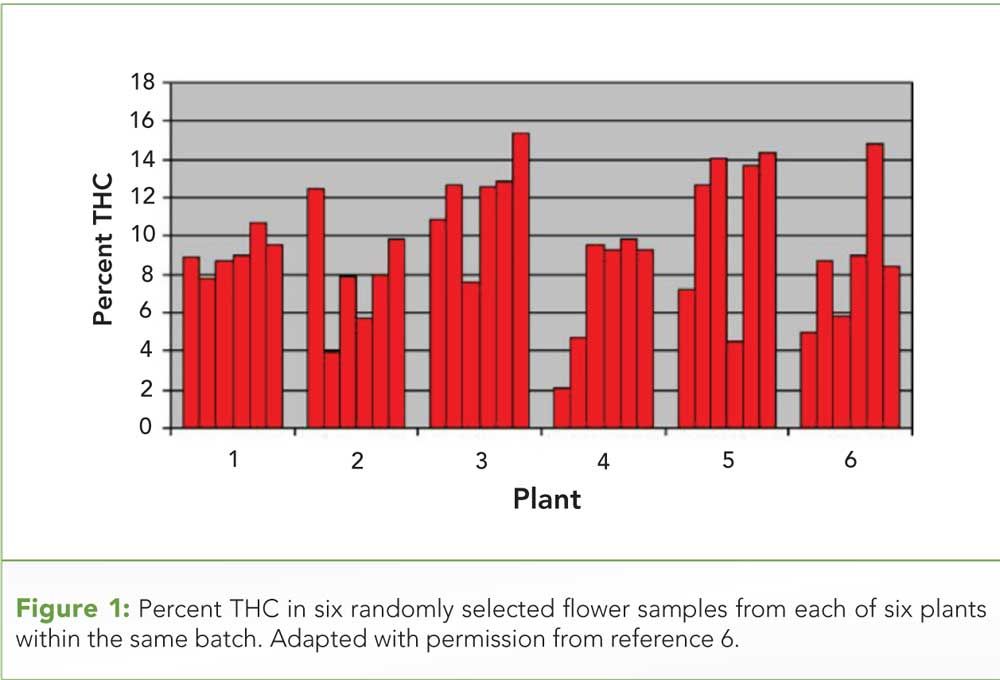
Figure 1: Percent THC in six randomly selected flower samples from each of six plants within the same batch. Adapted with permission from reference 6.

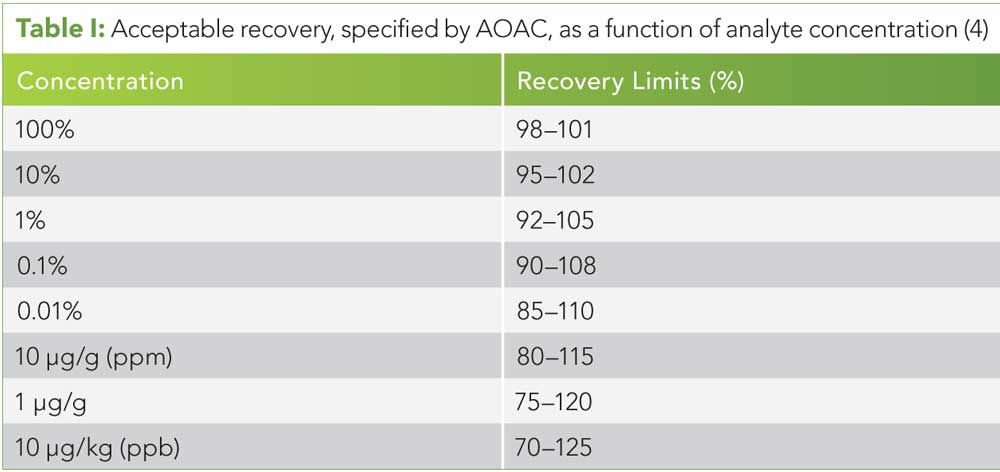
Table I: Acceptable recovery, specified by AOAC, as a function of analyte concentration (4)

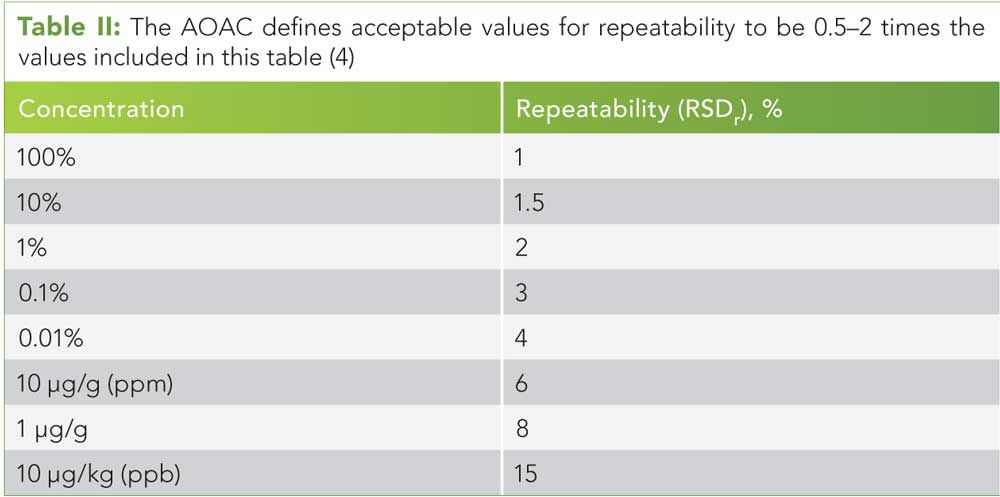
Table II: The AOAC defi nes acceptable values for repeatability to be 0.5–2 times the values included in this table (4)

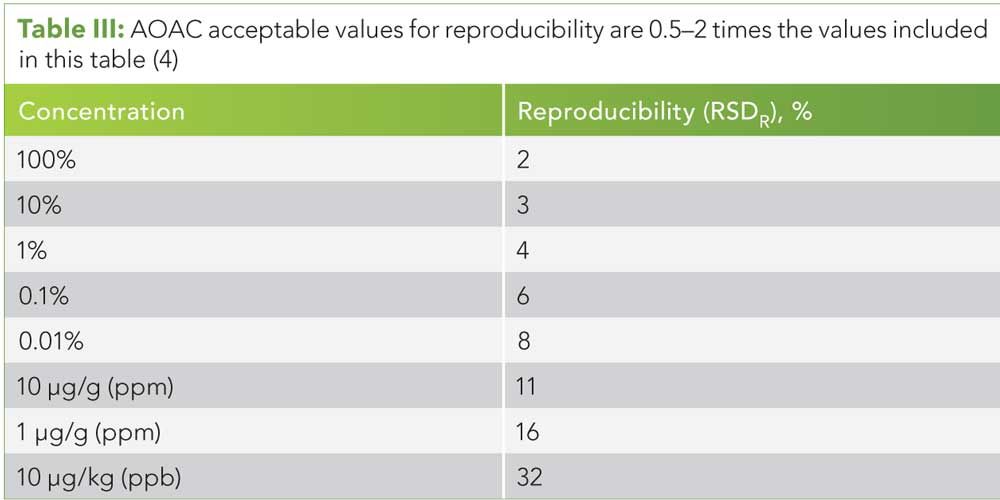
Table III: AOAC acceptable values for reproducibility are 0.5–2 times the values included in this table (4)

How certain can you be that every bud within a container labeled 9.25% â9-tetrahydrocannabinolic acid (THCA) is exactly 9.25% THCA? Wouldn’t you like to know? The uncertainty of the measurement of THCA must be accounted for. Uncertainty, in an analytical context, refers to the range around a reported result within which the true value can be expected at a certain probability. Intensively grown cannabis plants are highly heterogeneous. Cannabis heterogeneity is contributed genetically from decades of poorly documented hybridization experiments and compositionally from environmental factors. These variables, among others, affect the distribution of key active ingredients and are also likely to cause imbalanced distributions of contaminants such as heavy metals and pesticides. Therefore, no matter how accurate and precise a testing laboratory is in measuring cannabinoids or contaminants, the resulting uncertainty introduced by the plant plays a large role. Independent testing laboratories servicing the cannabis industry contend with this inherent cannabis uncertainty on a daily basis while complying with dynamic state-by-state testing mandates and client expectations. Here we illustrate the uncertainty contributed by cannabis heterogeneity and discuss the uncertainty contributed by laboratory measurement. We propose an accurate and transparent alternative method of relaying active ingredient content, and reference regulatory guidance for handling measurement uncertainty while quantifying and reporting contaminants. A specific example of how measurement uncertainty is involved in determining the pass or fail status of a product in regard to maximum residue limits is also provided and discussed. This article is intended to spark and aid conversations about measurement uncertainty that lead to the recognition and application of effective uncertainty budgets in the cannabis arena.
This manuscript describes “measurement uncertainty” (MU) from the perspective of two International Organization for Standardization (ISO)-17025 accredited independent testing laboratories that analyze cannabis products for potency, terpenes, homogeneity, microbials, mycotoxins, heavy metals, residual solvents, and pesticides. Focus is placed on measurement uncertainties when analyzing cannabis inflorescence, since cannabis extracts and infused products are more homogeneous (if properly formulated). Under the international standard, ISO-17025:2017, accreditation organizations are requesting that laboratories make available MU associated with laboratory methods. The official definition of MU is “a parameter associated with the result of a measurement that characterizes the dispersion of values that could reasonably be attributed to the measurand” (1). In the previous issue of Cannabis Science and Technology, Patricia Atkins provided an empirical description of MU (2). This article provides a link between empirical discussions on result uncertainty and their direct application to measurements in cannabis.
MU can simply be defined as the “give or take” of a measurement. This uncertainty is experienced in everyday life whenever a measurement is taken (how hot, how tall, or how heavy something is). Factors that contribute to MU should be identified and reduced when possible. Uncertainty can be determined by measuring the same sample prepared by different analysts, on different days, using consumables from different lots, and so forth. The maximum variability that the measurement method may encounter, within bounds defined in the standard operating procedure, should be explored and included during replicate analysis. It can be difficult to identify and include all factors of uncertainty present in a measurement. Therefore, we recommend first describing and reducing the MU contributed by the laboratory method, then using the optimized method to determine the MU added by the sample. We discuss the laboratory and sample contributions to MU separately, and refer to the combined MU, along with any adopted expansion, as the uncertainty budget.
Some regulatory guidance advises describing the uncertainty contributed by each identified factor, and then combining the uncertainties (by calculating the square root of the sum of the square of each identified uncertainty). This method requires separate calculations for each matrix type (flower, solvent extract, nonsolvent extract, and every different type of cannabis infused product) at each level of expected concentration for every analyte measured. The number of experiments required to accomplish such a task is daunting. In a field where products and testing regulations are everchanging, more plausible ways to determine uncertainty use means of accounting for unexplored variability, such as a “k factor.” A k factor is a multiplier applied to the found or calculated uncertainty that widens the MU range. It is meant to account for aspects of uncertainty that may have been left out of the MU calculation and provides more confidence that the true value exists within the reported range (95% confidence if a k factor of 2 is used) (3). Another conservative form of expanded uncertainty can be found in guidance documents that provide predetermined expanded uncertainties for a wide range of analyte concentrations (4).
Little regulatory guidance exists on the topic of MU and how it is to be considered when determining the pass or fail status of an analytical result. If a state regulation limits a residue to a concentration of 10 parts per billion (ppb), and a sample is found to contain 11 ppb of that residue, is that sample outside of compliance? What if the MU is ±50% at the 10 ppb level? The European Commission provides clear guidance in this situation regarding pesticides (5), but state-by-state regulations for cannabis testing do not. This article provides a glimpse into the intricacies of cannabis testing uncertainty. We propose implementation of expanded uncertainties, which should be considered by regulators when setting maximum residue limits (MRLs), and a transparent method of relaying MU of active ingredients to cannabis consumers.
Sources of Uncertainty
Contribution to Uncertainty From Cannabis Inhomogeneity
We all have seen and know what intensive agricultural monoculture looks like, think amber waves of grain or an ocean of corn plants, all uniform and genetically homogeneous. However, that same conclusion does not apply to intensively monocultured cannabis. Potency is dependent on flower maturity, and it is unlikely that all flowers within a plant are equal in cannabinoid content at a given time. It is even less likely that all flowers within a batch of plants are equal in maturity at the time of harvest. Within-plant variability and plant-to-plant variability regarding potency in cannabis has been previously demonstrated (6).
The results shown in Figure 1 were obtained from an experimental indoor hydroponic cannabis grow study in which New Zealand police officers purchased plants from an illegal grower. (See upper right for Figure 1, click to enlarge. Figure 1: Percent THC in six randomly selected flower samples from each of six plants within the same batch. Adapted with permission from reference 6.) Cuttings from a single plant were used to grow six clone plants. The variability of cannabinoid content between and within plants is evident. Though some of the variability may be attributed to the inexperience of the growers, it is not realistic to assume that even the most distinguished growers produce batches of flower where all buds are equal in potency. Expecting all buds within a container to be of the same potency is like expecting all grapes within a bag to be of the same ripeness. Similarly, contaminant levels are likely to be heterogeneously distributed and stored by cannabis. However, to our knowledge, no studies are available that describe the nature of contaminants in cannabis. The inherent inhomogeneity of cannabis flower poses a serious challenge that needs to be addressed for cannabis to continue gaining integrity in the advancing, evidence-based medicine trajectory of the cannabis industry.
One of the most effective, yet industrially unappealing, ways to mitigate cannabis inhomogeneity is to simply grind and mix (homogenize) the entire batch of flower before testing and dispensing. Buds at the extremes of cannabinoid and contaminant concentrations would dilute one another, resulting in a more predictable product. Not to mention the sample taken of the homogenate would be much more representative of the sample than even the most rigorous analytical sampling of intact buds. Unfortunately, ground cannabis flower is not currently an appealing product, so homogenizing cannabis would reduce marketability.
Keen analysts may suggest taking a larger, more representative sample of the batch for testing as a remedy, but this approach would just give a more accurate estimate of the average value and would not account for the expected range in values from bud-to-bud. Since homogenizing cannabis before sampling and sale is not a lucrative option, a more representative way of reporting cannabinoid content has been suggested, which is to report a range rather than an absolute value (7). Determining the range of analyte concentrations within a batch of cannabis flower would be a rigorous process, requiring enough separately tested buds to describe the span of concentrations present within a defined probability. The point is, if homogenization is not an option, the direct alternative is to quantify the inhomogeneity. Labeling finished cannabis product with a range of active ingredient content, instead of an absolute value, would temper cultivator expectation and allow consumers to make more accurate and informed dosing decisions.
Current laboratory practices are limited by the amount of product submitted for testing, and there is little encouragement to request replicate testing of the same batch to explore the variability of cannabinoid or contaminant concentration within and between plants. When a sample is submitted, it is homogenized by the laboratory before testing. This step minimizes the chance of measuring subsamples that are extreme in concentration or contamination, which gives a result that will more likely represent the average of the batch. Testing laboratories cannot completely control the uncertainty added by sample heterogeneity that exists before their interaction with the sample. Nevada regulation requires laboratory staff to visit grows to analytically collect representative samples for analysis, but they are still limited on the amount of product available for sampling, and sample size is directly correlated with the degree to which the sample represents the batch. Massachusetts regulation holds the cultivators of cannabis products responsible for sample selection, which further limits the capability of the laboratory to describe sample variability and sample representativeness. For these reasons, we recommend identifying factors in MU of the laboratory methods apart from sample variability by using replicates of homogenized sample. Separating factors of MU contributed by the laboratory from factors contributed by the sample mitigates complications related to sampling, and properly represents the accuracy and precision of the laboratory.
Contribution to Uncertainty From Testing Laboratories
Measurement uncertainty applies to all forms of quantitative testing (4). The true value of a measurement is an ideal that in principle is unknown. Common sources of uncertainty that should be considered in the measurement method include, but are not limited to, the following parameters: repeatability, reproducibility, recovery, stability, and bias. Sources of uncertainty should be identified for each analyte in each matrix type at each expected concentration level. Cannabis laboratories analyze anything from honey extracts to cannabis-infused suppositories, and each matrix brings a different array of possible uncertainty-impacting characteristics to the table. Concentrations of cannabinoids range from a fraction of a percentage to almost 100% of product weight and contaminant levels are required to be measured at parts-per-million (ppm) to parts-per-billion (ppb) levels. Some states regulate more than 100 analytes in cannabis. Massachusetts has 91, Nevada has 63, and these numbers will likely increase. Accounting for all factors of uncertainty under these circumstances is an arduous task.
We recommend starting with guidance from the Association of Analytical Communities (AOAC), who suggest ranges of acceptable recovery, repeatability, and reproducibility for a wide range of analyte concentrations (see Tables I–III) (4).
Acceptable recovery ranges have been defined differently in other regulatory guidance. The AOAC reference the 70–120% recovery criterian set by the U.S. Food and Drug Administration for drug residues at the 10 ppb level and the 50–150% critrian set by the U.S. Department of Agriculture pesticide residue proficiency study, but ultimately advise that recoveries outside of 60–110% be invesitgated and improved (4). Low recoveries are commonly because of inefficient extraction methods, while recoveries greater than 100% are possible because of matrix interferences in chromatography and ion enhancement in mass spectrometry. Cannabinoid recovery presents an unusually difficult situation for recovery experiments. Most recovery experiments are carried out by adding a known amount of standard to a blank or representative matrix, then dividing the analytical result by the theoretical result. No known blank or representative matrix has been established for cannabis. Furthermore, even if an appropriate blank matrix were agreed upon, cannabinoid standards are not available in concentrations above 1 mg/mL. Low-concentration cannabinoid standards limit recovery investigations to the lowest fraction of the range of expected cannabinoid concentrations found in cannabis. As Table I demonstrates, recovery is expected to be dependent on concentration, so the spiking method is not capable of describing the expected recovery for a majority of cannabis samples. (See upper right for Table I, click to enlarge.Table I: Acceptable recovery, specified by AOAC, as a function of analyte concentration (4).) AOAC Official Methods of Analysis, Appendix K, suggests that samples of this nature be evaluated for recovery by re-extraction after the original extraction (4). Recovery would then be calculated by dividing the first extraction result by the sum of the first, second, and third extraction. This method allows assessment of recovery of cannabinoids in cannabis at all possible concentrations and does not yield recoveries more than 100%.
Repeatability is examined by using the same method, laboratory, equipment, and instrumentation within a given time span. Variability of the results is expressed as percent relative standard deviation (%RSD), which is the standard deviation divided by the mean, multiplied by 100. As the concentration of a given analyte decreases, the allowed %RSD increases (see Table II). (See upper right for Table II, click to enlarge. Table II: The AOAC defi nes acceptable values for repeatability to be 0.5–2 times the values included in this table (4).)
The ability of a laboratory method to demonstrate the agreement of results from the same sample over a given time span is a fairly strong indication of the quality of the laboratory. Clients may test laboratory repeatability by thoroughly homogenizing a sample, splitting the sample into several sealed containers labeled with different identifiers, then sending the samples to laboratories for testing. The results can be used to calculate the laboratory %RSD. If the client is interested in the laboratory repeatability over a longer period of time, the samples should be submitted days apart. If the sample was not thoroughly homogenized (solid samples ground to a powder and liquid samples mixed vigorously), repeatability results may not be representative of the laboratory. Furthermore, if sample degradation occurs from the time the first sample is analyzed to the last, results will not be representative of the laboratory. These two factors should be kept in mind during all repeatability experiments.
Reproducibility is similar to repeatability, but usually includes a wider span of purposefully changed variables and therefore has larger acceptable uncertainties (see Table III). (See upper right for Table III, click to enlarge. Table III: AOAC acceptable values for reproducibility are 0.5–2 times the values included in this table (4).) Here we have the classic situation of a round-robin or blinded proficiency test across numerous laboratories where reproducibility conditions include the different methods, different laboratories, different operators, and different equipment and instrumentation. What makes reproducibility different from repeatability is the need to purposefully change a variable in the measurement process.
The reproducibility standard deviation or performance characteristic obtained in a round robin is a suitable measurement of uncertainty because it already reflects the methodological effects due to the different ways laboratories operate. Between-laboratory results are difficult to quantitate because of the competitive nature between laboratories in the same state, and because cannabis is federally illegal and cannot cross state lines. However, data resulting from the aforementioned method can be used by clients to assess laboratory quality and to determine a reproducibility result if more than one laboratory was included. Simply calculate the %RSD for all results from different laboratories for the same sample combined into one dataset. If a laboratory has already determined the MU for the method in question, then the results of the interlaboratory comparisons can be useful in checking this MU.
Recovery, repeatability, and reproducibility are just a chip off the iceberg in determining laboratory MU. Additional types of MU likely enter into a quantitative result and contribute to the uncertainty budget. Many resources exist that provide guidance on measuring additional factors of MU such as: Eurachem (8), Nordtest (9), Eurolab (10), and Codex CAC/GL 59-2006 (11).
Conclusion
The need for cannabis regulatory guidance to recognize and account for uncertainty in cannabis measurements has been made apparent. This article is not intended to provide clear solutions to the complex issues at hand, but rather to demonstrate the urgent need for discussion on the topic and to demonstrate the importance that uncertainties bring to the cannabis industry.
Uncertainty budgets are valuable diagnostic tools in the development and optimization of measurement procedures. Importantly, MU is a useful barometer for reporting of both active ingredients, such as â9-tetrahydrocannabinolic acid (THCA), and contaminants, such as myclobutanil, in the ongoing effort of cannabis testing laboratories to provide more transparency for the cannabis end user. Without inclusion of MU, the misconception that the average value is representative of each bud within the product will prevail. Making uncertainty budgets available, and incorporating them in laboratory reporting, would ultimately result in a more transparent and reliable cannabis market.
Conclusive uncertainty budgets, and guidance on how uncertainty budgets are to be considered in determining sample MRL compliance, have yet to be well defined in the cannabis arena. European Commission Guidance provides a direct example of how uncertainty budgets are to be considered in determining sample pesticide MRL compliance (10):
For official food control by regulatory authorities, compliance with the MRL must be checked by assuming that the MRL is exceeded if the measured value exceeds the MRL by more than the expanded uncertainty (x – U > MRL). With this decision rule, the value of the measurand should be above the MRL with at least 97.5% confidence. Thus, the sample is considered noncompliant if x – U > MRL. [For example], in case the MRL = 1, the result x = 2.2 and U = 50%, then x – U = 2.2 – 1.1 (= 50% of 2.2) = 1.1, which is > MRL.
This European Commission Guidance specifically states that it is to be used “to support compliance with, and specific implementation of ISO/IEC 17025.” However, discordance between regulation guidance is plentiful. Risk factors should be used to determine acceptable criteria and MRLs should be decided on with chosen MU criteria in mind. Cannabis is a new product with widely unexplored potential. Knowledge of how contaminants interact and persist in cannabis, along with toxicological studies on the inhalation of contaminants, should be used to shape future uncertainty budgets.
Both laboratories await to receive further guidance on how their respective states will acknowledge the role of uncertainty budgets in the calculation of reportable results on certificates of analysis. In the meantime, Digipath Labs, CDX Analytics, and a handful of other cannabis testing laboratories are letting both their respective states and their clients know that MU budgets are available to view.
References:
- International Organization for Standardization, ISO 17025:2017 Handbook. http://www.eurolab.org/documents/EUROLAB%20Handbook%20ISO%20IEC%2017025%202017.pdf.
- P. Atkins, Cannabis Science and Technology1(2), 44–48 (2018).
- “Guide to the Evaluation of Measurement Uncertainty for Quantitative Test Results,” EUROLAB Technical Report 1/2006, www.eurolab.org.
- AOAC official methods of analysis (2013) guidelines for dietary supplements and botanicals, Appendix K, AOAC Guidelines for Single-Laboratory Validation of Chemical Methods for Dietary Supplements and Botanicals.
- European Federation of National Associations of Measurement, Testing and Analytical Laboratories, EUROLAB Technical Report 1/2006: Guide to the Evaluation of Measurement Uncertainty for Quantitative Test Results. http://www.eurolab.org/documents/EL_11_01_06_387%20Technical%20report%20-%20Guide%20Measurement%20uncertainty.pdf.
- G. Knight, S. Hansen, M. Connor, H. Poulsen, C. McGovern, and J. Stacey, Forensic Sci. Int.202(1–3), 36–44 (2010).
- M. Sexton and J. Ziskind, “Sampling Cannabis for Analytical Purposes,” BOTEC Analysis Corp. I-502 Project #430-1e, (2013).
- EURACHEM/CITAC Guide, Quantifying Uncertainty in Analytical Measurement, 3rd Edition, 2012, http://www.eurachem.org/images/stories/guides/pdf/QUAM2012_P1.pdf.
- NORDTEST Report TR 537: “Handbook for Calculation of Measurement Uncertainty in Environmental Laboratories,” http://www.nordicinnovation.net/nordtestfiler/tec537.pdf, 2nd edition, Espoo, 2004.
- European Federation of National Associations of Measurement, Testing and Analytical Laboratories, EUROLAB Technical Report 1/2007: Measurement uncertainty revised: alternative approaches to uncertainty evaluation, www.eurolab.org, Paris, 2007.
- Codex Alimentarius Commission, CAC/GL 59-2006 (Amendment 1-2011) Guidelines on Estimation of Uncertainty of Results, www.codexalimentarius.net/download/standards/10692/cxg_059e.pdf, Rome 2006 and 2011.
Brianna Cassidy, PhD, is with CDX Analytics, in Salem, Massachusetts. Cindy Orser, PhD, is with Digipath Labs, in Las Vegas, Nevada. Direct correspondence to: cindy@digipath.com
How to Cite This Article
B. Cassidy and C. Orser, Cannabis Science and Technology1(3), 16-21 (2018).

The Cost of Compliance in the Cannabis Industry
April 1st 2025The financial and reputational risks of non-compliance far outweigh the upfront investment required to establish robust compliance systems. This blog explores the true cost of compliance, what non-compliance can mean for a business, and why investing in compliance is a proactive, strategic decision rather than a burdensome expense.