Looking with Light: Breaking Down Liquid Chromatography Method Development
A deeper look into the chemistry, physics, and methodology of HPLC methods.
The analytical scientist is often tasked with a difficult job of being accurate, efficient, and expedient in their work. Often these focused goals do not allow a lot of time for research and fine tuning of their workflow. Many chromatographers use methods they find from manufacturers or technical sources and adapt them to their situations and analyses. Sometimes the methods get adjusted or “tweaked” to improve the fit or increase the output but, unless the scientist is doing research or creating a totally new method approach, they build upon the backs of other methods. In this column, we take a deeper look into the chemistry, physics, and methodology of high performance liquid chromatography (HPLC) methods. We will look at how columns function and what changes can be made to increase resolution, efficiency, and separation to reach a laboratory’s chromatographic goals.
The start of method development is identifying and understanding the physical and chemical nature of the analytical targets and the scope of analytical instruments. Methods are a complete package of the chemistries, modalities, and functionality of all the targets, sample preparation, instrumentation, chromatographic phases, and parameters that allow for the separation, identification, and quantitation of the analytes of interest.
Often, ambitious analysts try to create a single method for all their analytes under one process and one instrument and end up with lots of mediocre data. Equally frustrating is setting up a method with standard conditions and settings without fine tuning it to the samples and analytes then becoming disappointed when the method “doesn’t work.” It is important to recognize that there will be instances where the sample preparation or the analysis method will require separate processes or “tweaking” to report all the target analytes efficiently and accurately. There is no one size fits all or straight out of the box solution.
Instrument Selection and Dynamic Range
I am sorry to say there is no one piece of instrumentation that will fill all needs. Some technologies have a wider range of targets, such as liquid chromatography–mass spectrometry (LC–MS) versus gas chromatography (GC)–MS, but each technique has its limitations and uses. Instrument choice is often dependent on the chemistry of target analytes and their potential analytical concentration. For instance, in cannabis there are several classes of organic analytes that are routinely examined including cannabinoids for potency; terpenes and flavonoids for identity, flavor, fragrance, and chemical fingerprinting; and pesticide residues or mycotoxins as potential contaminants. By their very nature all of these compounds occur in vastly different concentrations. Trace analysis (low parts-per-million [ppm] or parts-per-billion [ppb]) is the range for any method created to quantify potentially dangerous contaminants such as pesticides or mycotoxins and requires systems such as GC–MS, LC–MS and LC–tandem MS (MS/MS), which have sensitivity in those low ranges.
Cannabinoids and terpenes on the other hand can occur in the high ppm level up to the percent level and require a different range of analysis such as what is found in high performance liquid chromatography (HPLC) coupled with ultraviolet-visible (UV-vis) detection and GC coupled with flame ionization detection (FID). These two ranges of analysis often cannot be produced and quantitated by a single method of an instrument without significant changes to the samples.
The accuracy and ability to quantify analyte concentrations depends on the instrument's analytical specification levels and dynamic range often bracketed by the level of detection (LOD) and level of linearity (LOL)(Figure 1). The lowest limit of an analytical system is the limit of detection(LOD), this is the point where a target can be differentiated from a blank or noise with a high degree of confidence (usually over three standard deviations from the noise or blank response). The highest level of accurate quantitation ends with the LOL, where the linearity of the system starts to skew often due to detector saturation. Peaks that reach LOL appear broad, flatten at their apex, or are cut off before their apex.
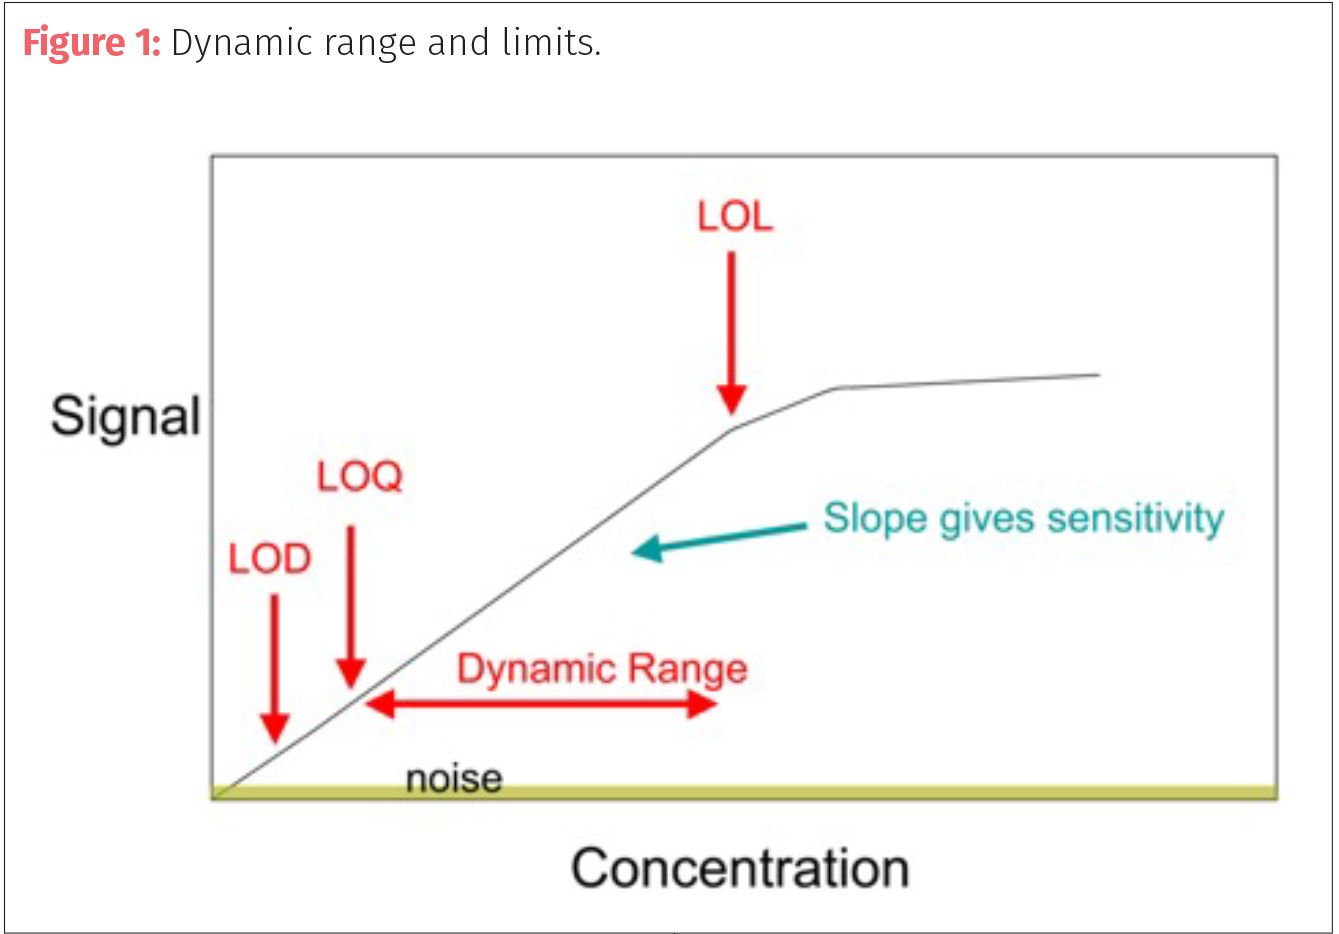
The range of the most accuracy (dynamic range) is between the LOD and LOL starting at the limit of quantitation (LOQ). The limit of quantitation (LOQ) is the lower limit of a method or system, which the target analyte can be reasonably calculated (over 10 standard deviations from the blank or baseline response).
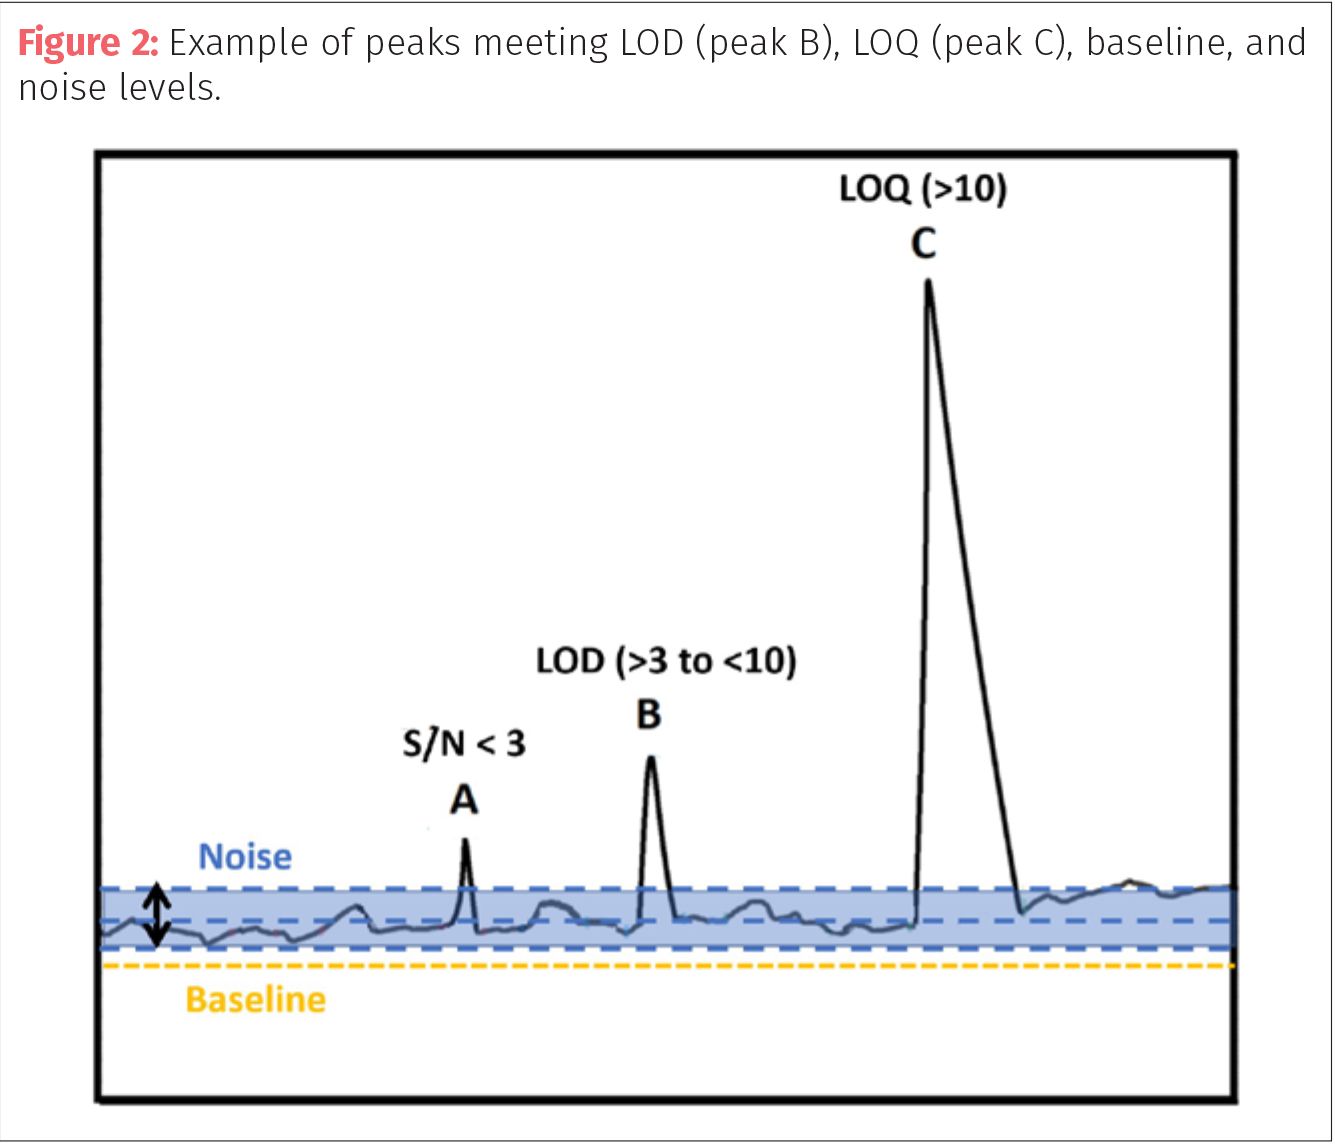
A simple method to determine if a response peak reaches the cutoff for LOD or LOQ is to look at the ratio of signal-to-noise (S/N). A blank baseline in chromatographic systems is rarely flat and straight. The lowest points of the chromatogram are a combination of the true baseline and system noise. Baseline noise is the sum of all the random variations (electrical, temperature, and so on) and contamination or interference from the chemical components.
To determine if a peak can be quantified, one can either compare relative heights or relative areas. In comparing relative height, the analyst averages the mean height of the noise and compares it to the height of the target peak from the noise mean height. To compare areas, one or more “peaks” in the noise are integrated with similar width to the target peak and the areas are compared. If the ratio is greater than three then it qualifies as within LOD and if the ratio is greater than 10, then that peak can be used for quantitation (LOQ).
The best practice is to integrate the noise at the baseline at several points and average the baseline noise responses then compare to the integrated peak of interest (Figure 2). For example, if the chromatographer is interested in peak A, they should integrate areas of baseline near the peak of similar peak widths to the target or measure its height compared to the average range of peak heights found in the noise. If the average of those baseline noise peaks is 100 units (height or area) then peak A must be at least 300 units to meet the LOD criteria of 3X. If peak A is only 200 units then it fails and cannot be used for either identification or quantification. If peak B is the peak of interest and has a S/N >3 but <10, then it can be used for detection (LOD) and possibly identification but should not be used for quantification (LOQ). Finally, a peak such as C can be used for both identification and quantification because its S/N value is higher than 10.
Instrument sensitivity (represented as S/N) can be increased by decreasing baseline noise without increasing the target response. Noise in a system can be created by matrix from the extracted sample, contamination of the sample, and contamination of either the stationary phase or mobile phase. Proper sample clean-up and processing can sometimes reduce baseline noise, so the target peak is not “lost in the weeds” of the baseline. Often it is believed that one can get a better response by injecting a larger sample aliquot, but if the sample matrix is a contributor to the noise, then a larger sample means more matrix as well and will not necessarily help with the issues of S/N.
As for the mobile phases, impurities in mobile phase can directly affect baseline noise. The wrong grade of gases in GC can create high baselines while HPLC mobile phases can accumulate contamination by exposure to the laboratory environment. Replacing old solvents with fresh solvent can dramatically lower HPLC baseline noise. In some cases, especially in LC–MS and ppb analysis, the use of highly filtered LC–MS solvents can also play a role in reducing baseline noise.
Solid phase contamination and build up can play a role in baseline noise. As columns age, the backbone materials—silanes, siloxanes, and so forth—can break down or lose protective end capping, which increases noise. Harsh or acidic HPLC mobile phases can strip column phases and promote column breakdown. By examining the chromatographic baseline and cleaning up the contributing factors it can ensure that more target peaks fall into the LOQ needed for many analyses.
Understanding the Targets
HPLC is a powerful analytical tool that needs extensive adjustments to maximize its accuracy and efficiency. All the adjustments and fine tuning of parameters ultimately are based on the targets of interest. Generally, chromatographers group targets as either polar or nonpolar analytes, with some fluctuating between the two classifications. Nonpolar analytes such as alkanes and alike often are targets for normal phase chromatographic methods while polar analytes such as carboxylic acids, will be examined with reversed-phase chromatographic methods. The majority of modern HPLC analysis falls under the classification of reversed-phase LC.
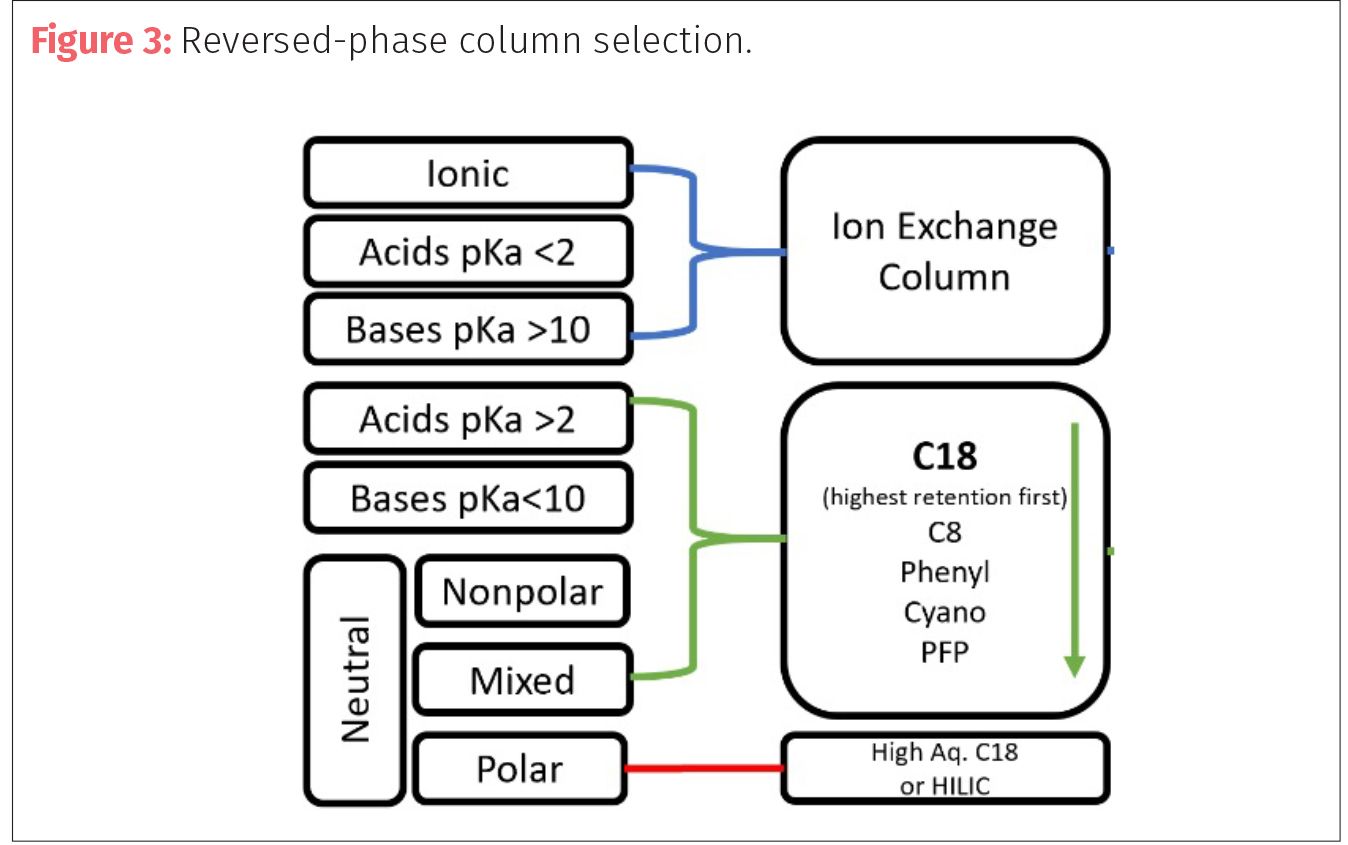
The parameters of reversed-phase LC dictate that the mobile phases used with be polar solvents while the stationary phase (column) will be nonpolar. Target analytes that dissolve in polar solvents and water will then use either ion-exchange columns or reversed-phases columns depending on their chemistry (Figure 3). The most common reversed-phase LC columns are the C18 or C8 columns since they service a wide variety of chemistries. Column manufacturers may change or supplement the chemistries of their standard C18 columns with different modifiers, which can assist with particular issues such as resistance to highly aqueous methods or better retention of highly polar compounds.
The chemical properties (in addition to the concentration) of your targets will dictate—to a degree—the type of instrumentation that will be needed for analysis. As was stated previously, the concentration of analytes can dictate instrumentation such as UV over MS. But the chemical nature of the compounds will play an important role not only in selecting the right column but the right detector. Compounds that are easily ionized can be detected using electrospray ionization (ESI) with LC–MS. But, if your compounds are not as easily ionized then other atmospheric pressure ionization sources, such as chemical and photoionization (APCI and APPI) need to be considered if LC–MS is the method of detection. Molecules with chromophores can utilize UV-vis detectors, while fluorescent molecules can utilize other chemiluminescent detectors.
Once the chromatographer understands their target analyte’s range requirements, selected instruments, detectors, and targeted possible column chemistries it is time to start building or refining an analysis method.
Initial Method Considerations
One of the first questions asked when researching a new method is: Has anyone already created a method for my analysis? The good news is that most of the time someone, somewhere, has performed a similar analysis on a similar class of compounds or a similar type of material. The bad news is that the methods you find usually are a starting point and not an out-of-the box solution. Methods that are found in journals and websites are not necessarily a perfect fit for your laboratory’s instrument configurations nor are they all validated for the purpose you might need (if they are validated at all).
In some cases where there are different size columns, tubing, particle, or pore size, it is helpful to use an HPLC method translation tool to help alter flow rates and gauge retention time. One free method translator tool can be found at: https://www.acdlabs.com/resources/freeware/translator. A downloadable excel calculator can be found at: https://ispso.unige.ch/labs/fanal/hplc_calculator:en. Method translation tools do not always take into consideration what may be practical for your system. They are usually just sophisticated calculators. The resulting parameters may exceed the capacity for your system (that is, the back pressure created will be too high, or the injection volume cannot be achieved with the system). Again, these parameters are meant to be a starting point for optimization and must be examined with a critical eye.
In initial method development, it is best to start by separating targets from either a standard or a well-characterized sample to achieve separation, then use various concentrations and matrices to improve sensitivity and response. An initial chromatogram may have multiple unretained or overlapping (coeluting) analytes. It is also possible to have peaks retained on the column past the method run time (Figure 4). It is also possible that “negative peaks” (peaks or dips below the baseline) can be seen in the chromatogram, usually appearing right before the unresolved peaks.
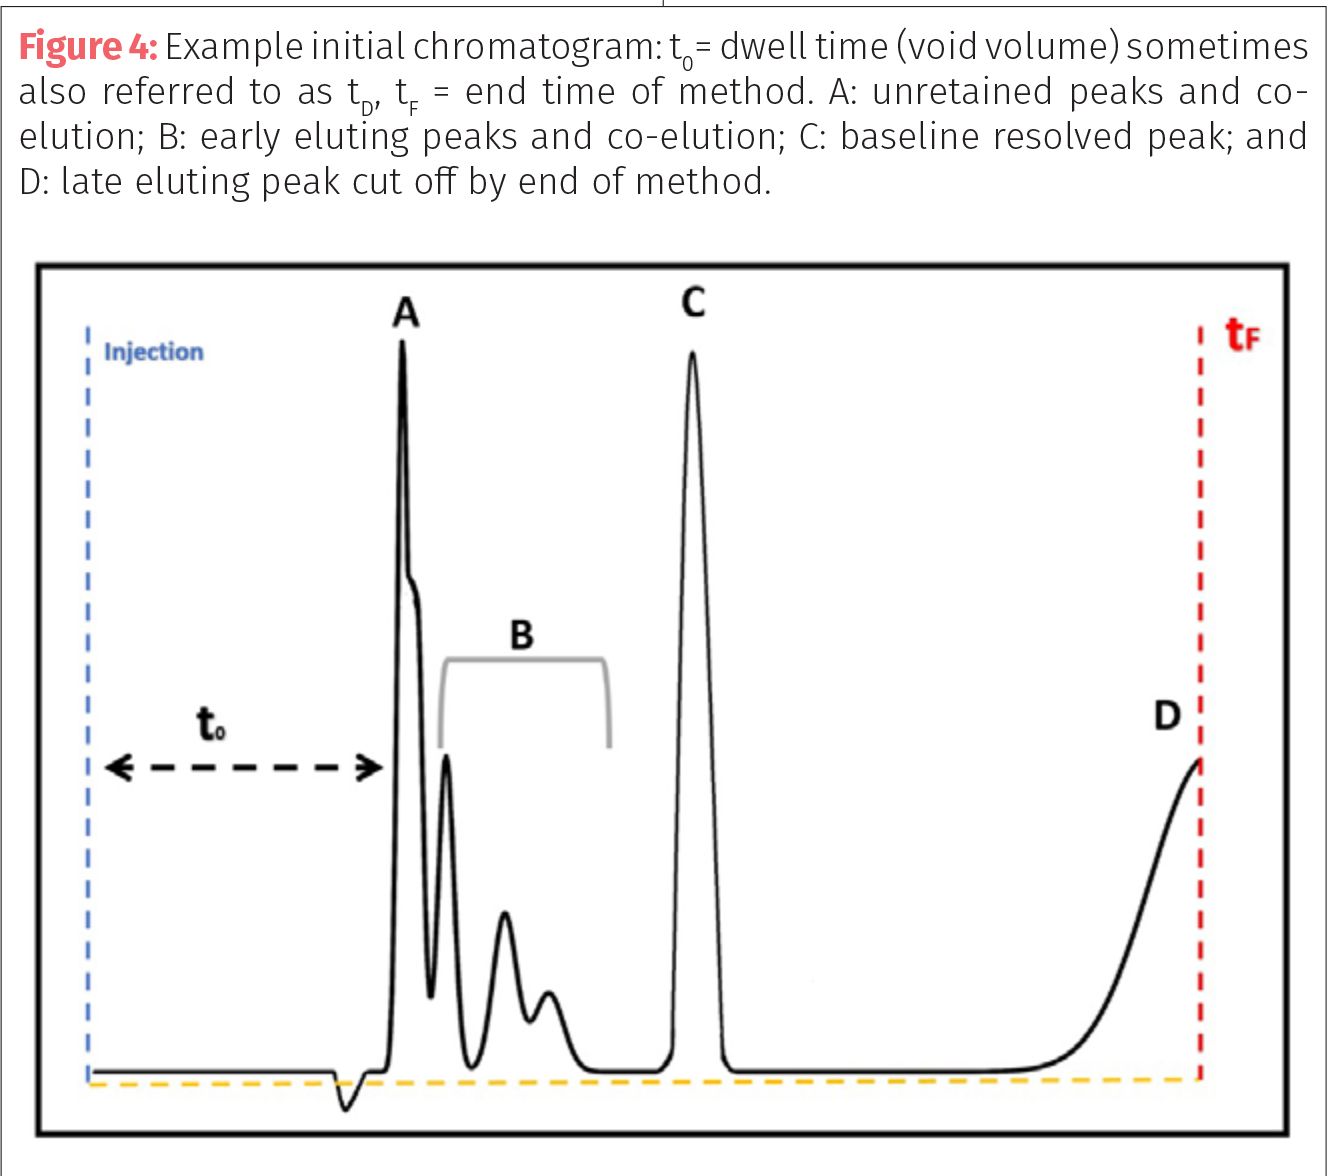
Negative peaks are a visual representation of the difference or change in detector response that result in response below the baseline or set point. These peaks can be caused by a number of issues including the movement of internal values such as when the injector values switch back and forth from injection to normal flow path. Another way negative peaks can be observed is when the solvent used to dilute your sample differs from the solvent composition of the HPLC system. For example, if your extracted sample of cannabis is in 100% ethanol, but the HPLC mobile phase starts as 50:50 water–acetonitrile; then you may have a significant negative peak as the ethanol hits the detector due to changes in absorbance, refractive index,
or conductivity.
In any method development it is best to remember the old adage: “Slow and steady wins the race.” Change one parameter at a time and then move on. It is very tempting to change multiple parameters (mobile phase, additives, flow rate, temperature) all at once to save time and effort. Unfortunately, often it dilutes the effort, and you cannot track which changes give you the
best resolution.
Achieving Resolution
There will be times that there are only general methods available that are remotely similar to your intended analysis; in that case basic parameters become the starting point on which to build a method that provides resolution of target analytes. Peak resolution—the ability of a column to separate peaks in a chromatogram—is a complex interaction of forces and factors observed as adjacent peaks merging (coeluting) to a single peak or separating (resolving) into two or more peaks. Resolution is the relationship between the differences in retention times of two adjacent peaks divided by the sum of the peak widths of the two target peaks at the baseline.
Retention time or Rt is the time between injection and the appearance of the peak maximum or apex. The first step in evaluating another analysts’ method is to try and duplicate all the conditions, instrumentation, columns, mobile phase, and settings described then run a known test sample or standard to obtain a starting chromatogram.
Peak width or band width (w) is the width of the peak or chromatographic band measured at the baseline by drawing tangent lines from the inflection points of the curve that represents the peak. The resolution between two adjacent peaks of similar heights can be calculated using the resolution equation (Equation 1): For example, if an analyst is separating cannabis terpenoids and there are two terpenes that resolve at 7.5 min and 8.0 min with peak widths of 0.5 min and 0.75 min would have R = 2(8.0 – 7.5)/(0.5+0.75) = 0.8
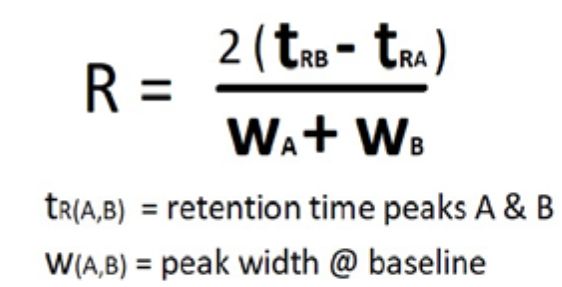
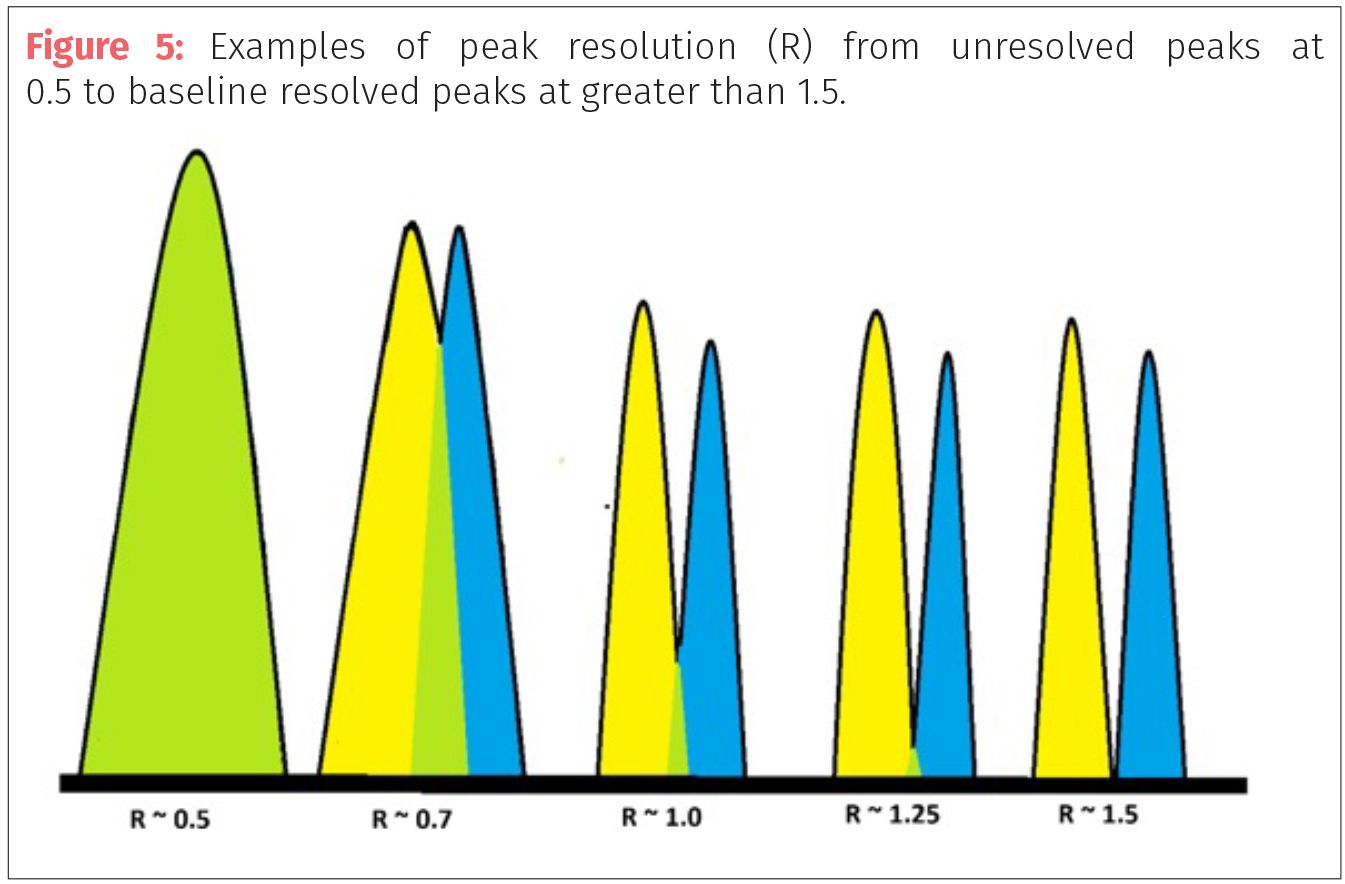
Peak resolution needs to have R >0.6 to be able to discern separation between two peaks of equal height. Two peaks with values of R >1.5 are considered to have good resolution and peaks of R >2 are fully or baseline resolved. In our example, the two terpenes would be coeluting with some minimal separation at the apexes (Figure 5).
For a cannabis analyst who needed to separate all the terpenes, cannabinoids, pesticides, and so on, effort to increase resolution would have to begin. According to the first resolution equation, resolution is affected by peak width and retention time. To improve resolution the analyst would have to either increase the retention time of one of the peaks (meaning that they would have to find a way to keep the peak partitioned in the stationary phase for a longer time) or decrease the peak width. There are three basic HPLC parameters that the chromatographer can use to change conditions of their method: mobile phase composition, solid phase chemistry, and flow rate. The usual first step to increase the amount of time an analyte spends in either phase is to change the composition of the mobile phase, usually by changing the gradient program.
Peaks that elute early in the chromatogram and spend too much time in the mobile phase and are not being retained well by the stationary phase. These compounds are more polar or are hydrophilic. Most reversed-phase LC gradient methods start with a high concentration of water (50–80%) and a lower concentration of organic mobile phase. The general rule of thumb for reversed-phase gradient methods is to start organic solvents low and increase to high. If you have early eluting compounds it means you either have to start with slightly less water mobile phase or change the stationary phase chemistry (column). Changes to the flow will not help unretained peaks and very early eluting compounds.
Peaks that elute late in the chromatogram spend too much time with the stationary phase and only elute when the organic mobile phase concentration is high enough to force them from the column. These compounds are less polar and more hydrophobic. To speed up late eluting compounds the organic phase can be increased more rapidly by increasing the gradient slope. Changes in the stationary phase chemistry can also be used to resolve late eluters. Sometimes increasing flow rate can help stop late eluting peaks from being lost if they are retained on the column until after the program ends. Some instruments allow for changes in flow rate over the method run and increasing flow rate may assist with late eluting peaks in this approach.
Generally, flow rate is not the first choice for peak resolution. Resolution is a function of peak width and time, which we observed in equation 1, so by increasing flow you do decrease the peak width, but you also decrease the difference in retention times, which has a bigger impact on resolution. But resolution is also a function of three other factors: retention (or capacity), separation (or selectivity), and efficiency characterized in Equation 2 for isocratic methods:

Retention or capacity factor (k) is the time that a sample analyte resides in the stationary phase relative to the time it spends in the mobile phase. It is calculated from time difference between the analyte peak (tR) and the unretained peak divided by the time of the unretained peak (t0)
(Equation 3).

Capacity factors or retention values less than five have the biggest effect on resolution. For example, if k = 10 then in the resolution equation 2 – the factor for retention is 10/(1+10) which is close to 1; but if the k = 1, then the retention factor is 1/(1+1) or ½ and will have a larger impact
on retention.
Separation or selectivity factor (α) is the ability of a chromatography system to distinguish the chemical differences between compounds. It is measured as a ratio capacity factors (k) of the two peaks being examined (Equation 4).

Efficiency (N or H) is a measure of theoretical plates in a chromatographic system. Theoretical plates are a concept described by the Nobel prize winners Martin and Synge in which they related the theories of distillation to chromatography. In distillation columns for crude petroleum, there are actual separator plates to help separate and isolate petroleum fractions. Early petroleum distillation used different length columns that related to its efficiency. Chromatography columns do not have physical plates that can be measured, so the plates are theoretical to describe the efficiency of the column. In this regard, the length of the column is called a height equivalent to a theoretical plate (HETP) and is measured as column length (L) divided by theoretical plates (N). Efficiency or theoretical plates are calculated as by the relationship between peak retention time (tR) and the peak width at baseline (wb) (Equation 5).

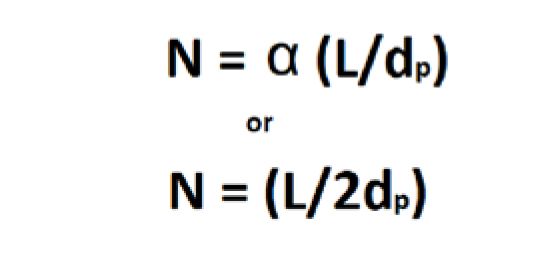
If peak width is taken at the half height point in the peak it is called width at half height (w1/2) and is multiplied by 5.54 instead of 16. Efficiency (N) can also be calculated as a relationship of retention time (tR), peak height (hp), and peak area (A) (Equation 6). Finally, efficiency can be measured as a relationship between separation factor (α), column length (L), and particle size (dp) (Equations 7 and 8).

Starting with Mobile Phase Chemistry
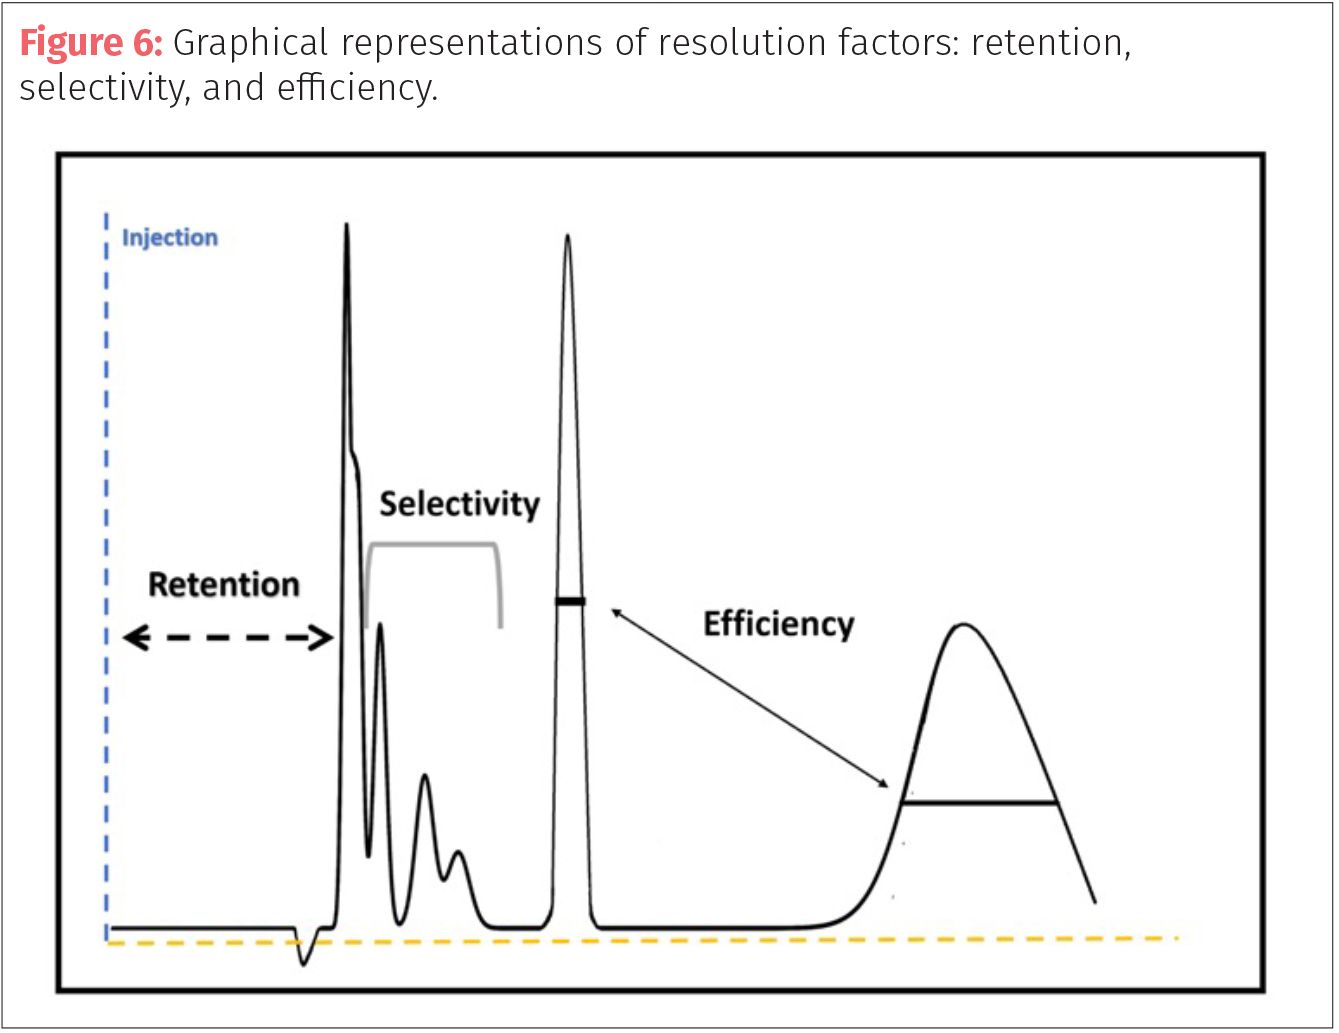
If the chromatographer wants to increase resolution, then they must find a way to increase one of the three factors: retention, selectivity, or efficiency (Figure 6). In many cases, the first place to start is altering the mobile phase instead of changing columns (stationary phase). The goal is to increase the time the peaks spend in the mobile phase. Increasing retention will result in peaks spending more time in the solid phase, moving the peaks apart but it can result in band broadening (increased peak width over time of analysis) and this approach only works best on early eluting peaks (which the retention factor is less than five). One way to increase retention (k) is to use weaker solvents or ones with lower elution strengths.
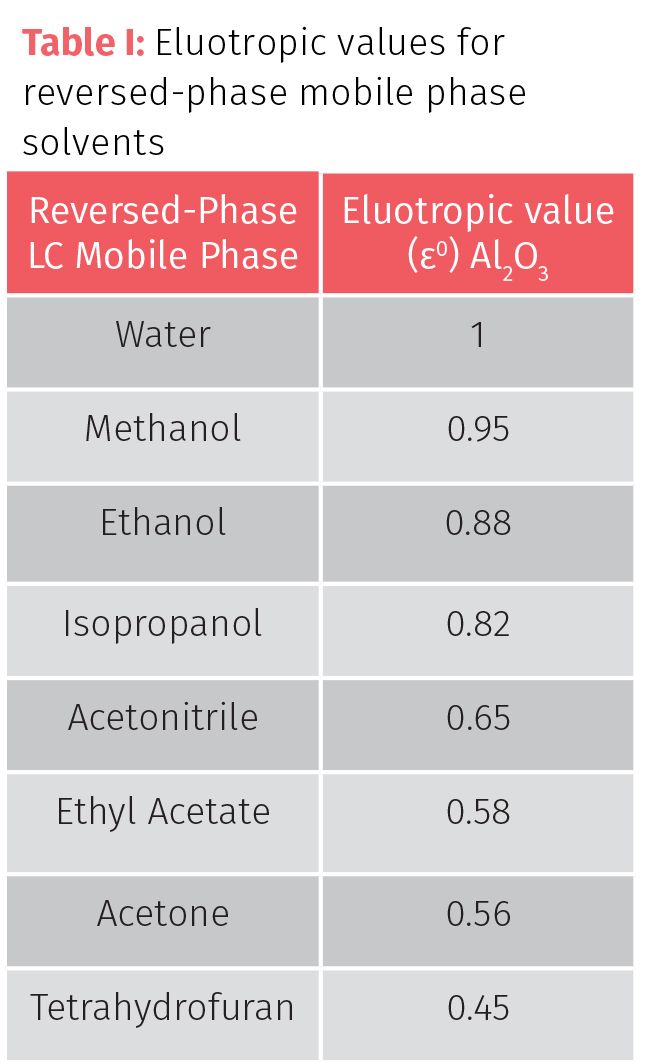
In my previous column, the concept of eluotropic value (ε0) was introduced. Eluotropic value (also known as elution strength) describes the ability of a solvent to pull an analyte from the solid phase. The larger the ε0 of the solvents of the mobile phase relates to less retention (Table I). Water has a high ε0, so using a lower concentration in the mobile phase can increase retention. Switching solvents for lower ε0 solvents such as changing methanol (ε0=0.95) for acetonitrile (ε0=0.65) is the best way to increase retention, but will increase in method analysis time. The customary approach for developing methods for a sample with many types of analytes is to increase k for early eluting compounds and decrease k for late eluting compounds.
Since selectivity is related to retention, many of the same approaches such as changing solvents is effective as a method to change selectivity. Selectivity can also be changed by chemical effects to solvent through additives and pH modifiers. The chemical nature of the target analytes become important, especially in the understanding of pH, pKa, and pKb which are the basis for all acid-base interactions. The letter p means that value or measurement is based on a logarithmic (-log) value or measurement. Then pH is the measurement of hydrogen ion concentration of a compound in an aqueous solution, where pH = -log [H+] and equates to relative acidity or alkalinity of a compound. The scale ranges from 0 to 14, where low values equate to acidic compounds and high values are alkaline. Neutral for the scale is pH of 7. The pH of a solution indicates an acid or base, but not necessarily the true strength of that acid or base. To measure the strength of an acid or base, one needs to look at the pKa or pKb.
The terms pKa and pKb are the -log of Ka and Kb (acid and base dissociation constants) that predict if a compound will donate or accept protons at a specific pH. These values are true indicators for the strength of an acid or base since they are unaffected by the amount of water added to the solution. For acids, smaller pKa values indicate stronger acids while in bases smaller pKb indicate stronger bases. By adding buffers to mobile phase, the chromatographer can change resolution (Table II). As methods are being developed, always start with weaker acids at the lowest functional concentration possible (~ 0.01 M) and increase in acid strength and concentration until the desired results are achieved. High levels of buffer (>0.1 M) since extreme pH (very acidic or very basic) can damage columns and increase they viscosity of the mobile phase thereby increasing pressure in the system. Most columns are safe in the range between pH 2 to 7.5 (but consult column specifications). For basic or mixed sample types, mobile phase pH near neutral increases retention, while acidic sample are aided by acidic mobile phase.

If an acid analyte is in a mobile phase whose pH is similar to the target analyte’s pKa, then there is lower degree of ionization and an increase of retention can be observed. When mobile phase pH is significantly over or under an analytes pKa or pKb then the degree of ionization increases and reduces retention. So, protonated basic analytes may have low retention at acidic pH while acidic analytes will have increased retention.
The reverse can also be true that basic analytes in a high pH mobile phase will increase retention where acid acids will decrease in retention. Differences between target pKa (or pKb) and mobile phase pH and pKa are of even more importance in LC–MS where ionization is critical to detection. Keeping mobile phase (and buffers) pH and pKa similar to the target improves resolution because it moves the ionizable target to a more neutral state, but for LC–MS to be effective the compound needs ionic character or to have the ability to be easily ionized. Therefore, the rule of thumb for pH, pKa, and mobile phase is to aim for mobile phase pH 1–2 units from the target analytes pKa within the specification range of the column.
It is important to remember that not all buffers are appropriate for all applications. Salts can precipitate out of solution as mobile phase composition changes. Salts are also problematic for LC–MS analysis since they can inhibit ionization. If solids are dissolved into mobile phase it is important to remember to filter the mobile phase and, in some cases, the mobile phase may need to be heated to dissolve solids completely. Changes in column compartment temperature may aid in keeping buffers in solution.
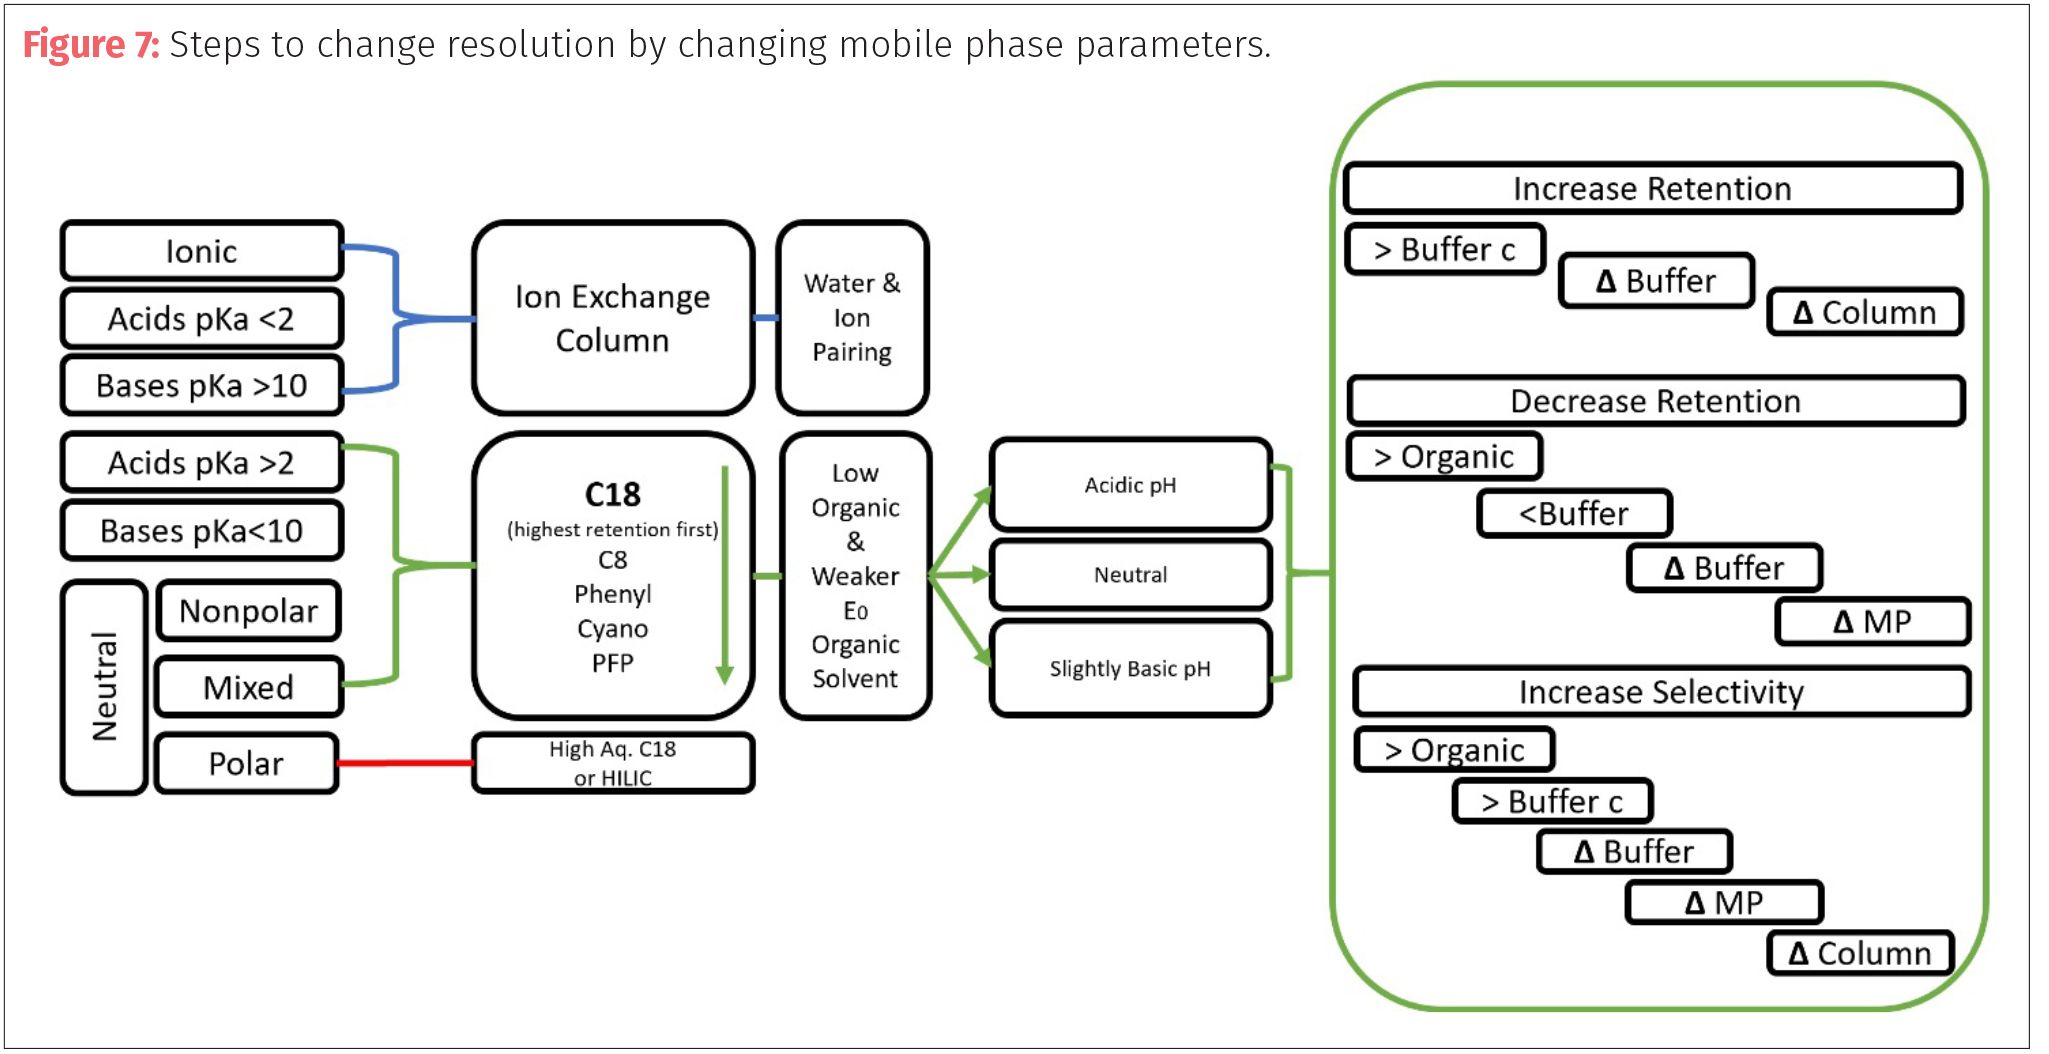
In some cases, temperature of the column compartment can be used as a tool to alter the retention and selection of a method. Keeping a constant temperature can often help with fine tuning a retention time by eliminating external temperature changes. Some reduction in retention (k) can be achieved by increasing temperature allowing for peaks to elute earlier. Many changes to resolution (retention, selectivity, and efficiency) can be made by the manipulation of the mobile phase chemistry (Figure 7).
Changing Columns
There will be times when all the changes to mobile phase have not resulted in the desired resolution (retention, selectivity, and efficiency) so then it is time to consider a different column chemistry or different physical column parameters.
In reversed-phase LC, the most retention is usually found in C18 columns followed in descending order to C8, C2, and so forth. The lowest retention is found in phenyl and cyano columns. Most reversed-phase LC systems have some form of C18 column as part of their standard materials package from a manufacturer upon set up and is often the most used or tested column to start method development. The specifications for the column should designate its internal diameter (mm), length (mm), particle size (µm), and pore size in Angstroms (Å ). A fairly standard size for a starting column is 4.6 mm x 100–150 mm, 5 µm and 80–100 Å.
The physical column characteristic can have a large effect on the resolution, system pressure and analysis time. First, let us look at column length. Increasing the length of the column has a direct effect on efficiency from Equation 7. Doubling the length of the column does give you a resolution increase of about 1.4x, but it also doubles the pressure and analysis time. Resolution is increased at the expense of time and pressure. So conversely, if you want to decrease back pressure and decrease analysis time then a shorter column is needed, but that will reduce resolution.
The second parameter of the resolution from equations 7 and 8 is particle size. As the particle size increases (without any change in column length), resolution, and efficiency (theoretical plates) will decrease. Smaller particles increase resolution, efficiency, and retention but they also will exponentially increase pressure of the system: P α (1/dp)2. Modern HPLC systems have increased their ability to handle higher pressures and often can handle increased pressure from smaller particles. If smaller particles are needed to maximize resolution, then the chromatographer can reduce column length to reduce pressure and not effect efficiency dramatically since efficiency is inversely proportional to particle size and directly proportional to length. The benefits of this approach are shorter run times, less solvent use since column volume is reduced, and less backpressure with increased resolution.
The diameter of a column becomes important in the discussion of pressure, flow, and column volume. Columns of diameters between 3.9–4.6 mm range are considered to be standard bore. Diameters in the range of 2.0–3.2 mm are called narrow bore. Columns with diameters of 1.0 or less are considered microbore or capillary columns. The diameter of the column effects peak height, which can also affect efficiency as seen in Equation 6. Changes in column diameter must also consider changes in flow rate (which is the volume of mobile phase divided by time) and linear velocity (µ), which is the distance mobile phase travels over time. By adjusting flow rate to maintain linear velocity, peak height is increased, and band broadening is decreased allowing for improved retention.
One of the final dimensions of a column is pore size. The stationary phase is composed of particles that are riddled with spaces and openings. The spaces allow for increased surface area and interaction between the target analytes and the stationary phase. Typical pore sizes can range from 50 Å to over one million Å. The choice of pore size is dictated by the approximate range of the molecular weights of the various target analytes. Most small to mid-range molecular weight analysis (<1000 mw) can utilize 50–100 Å pores. Some specialty molecules with stereochemistry considerations could require larger pore sizes to accommodate steric interactions with the stationary phase. Small pores have larger amounts of surface area than larger pores and allow for much more interaction between molecules and the stationary phase.
Band Broadening and Peak Shape
A final consideration on the resolution of a method is the appearance of the peaks. Most of the calculations for peak height and peak width are made for Gaussian peaks with equal symmetry. However, as has been discussed the chemistry of the mobile phase, stationary phase and column conditions can contribute to distortions to the peak symmetry and band broadening. Symmetry (T) of a peak is measured by dividing a peak down the from the apex and comparing at 10% peak height the ratio of the tailing side (B) to the earlier fronting side (A) in the equation T = B/A. For Gaussian peaks (Figure 8a) the sides are equal, so the ratio is 1. In fronting peaks (Figure 8b), the wider side appears first so the ratio is less than one, while tailing peaks (Figure 8c) have ratios greater than one.
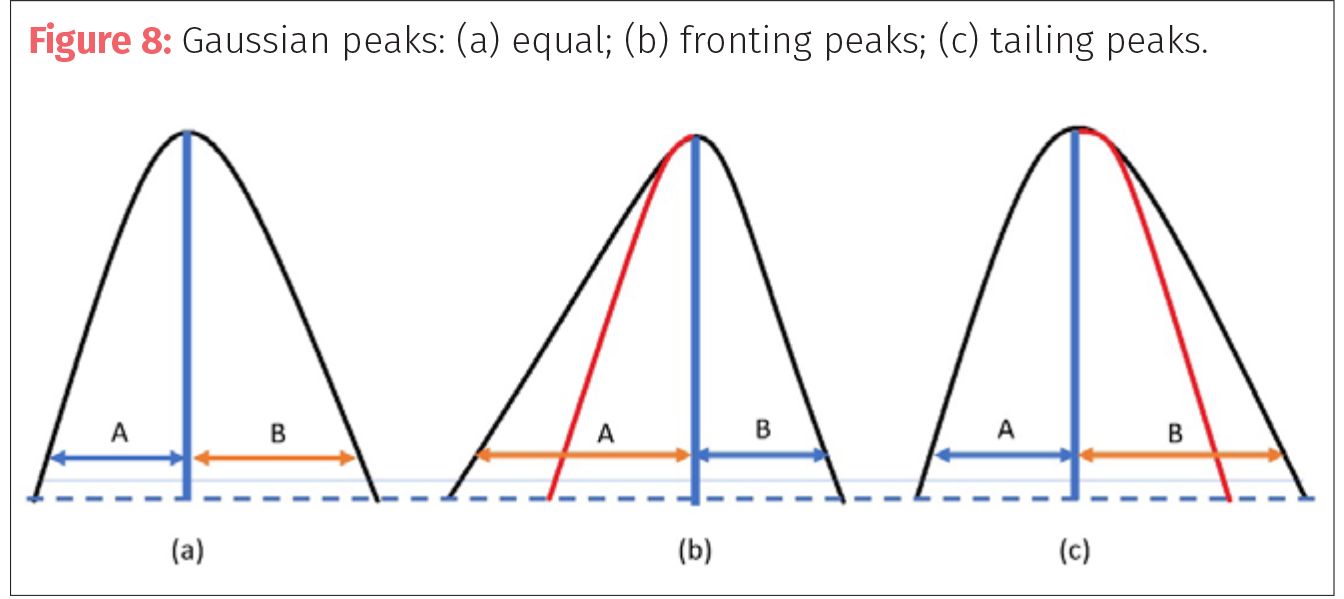
taIn most cases, peaks that fall within 0.9 to 1.3 are considered within acceptable range. Peak fronting can be a result of not enough retention (k) on the column (that is, peak capacity), or an effect of the matrix of the sample having stronger elution power than the mobile phase. Fronting can happen when the analyte is overloaded on the column or in the detector and may need dilution or a smaller injection volume to avoid saturation. Peak tailing can be cause by many issues including oversaturation of column or detector, or diffusion in the flow path by connectors, column voids and fittings. Tailing can occur from pH effects if the pH of the mobile phase is close to the pKa of the sample or analytes. Increasing or decreasing the pH two units from the target pKa will reduce tailing. Peaks can be seen to tail as columns age and more silanols are exposed or if using columns without end capping. The interaction with these open silanols or the silica can create the bleeding of peaks seen in tailing.
Asymmetrical peaks can reduce resolution by decreasing efficiency and retention. If the chromatogram shows consistently asymmetrical peaks then take care to examine all fittings, columns, junctures for excess flow paths, dead volume, and air incursions. If the asymmetry persists examine the sample dilution composition and try to match the mobile phase composition. Mobile phase should measure 2 pH units above or below the sample or target pKa. The chromatographer can also check the age and condition of the column and replace older columns or change to columns with end capping to increase symmetry.
Final Thoughts
The goal of method development is resolution of all the target compounds of interest in a sample. Sometimes targets will have to be prioritized so that maximum resolution is gained for the analytes of interest. Those analytes should be ideally near the middle of your chromatogram away from the solvent front and before any chances of band broadening can occur.
Resolution is dependent on the key factors of efficiency (N), retention (k), and selectivity (α). Efficiency can be increased by increasing column length (L) or in some cases modifying or controlling column temperature. Other factors that can increase efficiency include reducing dead volume, peak tailing and finally particle size. Selectivity (α) and retention are linked together and can be changed by changing similar parameters such as the elution power of the mobile phases, changing the pH of the mobile phase by the use of additives or buffers, or by finally changing the stationary phase chemistry.
The first changes during method develop often revolve around changes to the chemistry and composition of the mobile phase. If those changes fail to produce adequate resolution, then the analyst should start to examine changes to physical system parameters and finally the column or stationary phase chemistry and dimensions. There are often no shortcuts or out-of-the-box solutions to method development. One should always try to find references as a starting point, but ultimately those methods will have to be adjusted to the particular parameters and idiosyncrasies of the individual system and the target samples. The best approach is to take changes one at a time and work in a slow, steady pace to optimize all the parameters of the mobile phase, stationary phase, and system to achieve the best method for your analysis.
Further Reading
- P.L. Atkins, Cannabis Science and Technology 1(2), 44–48 (2018).
- P.L. Atkins, Cannabis Science and Technology 4(1), 20-30 (2021).
- J.W. Dolan, LCGC North America 28(2), 114–120 (2010).
- D. Guillarme, D.T.T. Nguyen, S. Rudaz, and J.-L. Veuthey, European Journal of Pharmaceutics and Biopharmaceutics 68(2), 430–440 (2008). https://doi.org/10.1016/j.ejpb.2007.06.018.
- D. Guillarme, D.T.T. Nguyen, S. Rudaz, and J.-L. Veuthey, European Journal of Pharmaceutics and Biopharmaceutics 66(3), 475–482 (2007). https://doi.org/10.1016/j.ejpb.2006.11.027.
- D.D. Guillarme and J.-L. Veuthey, Guidelines for the Use of UHPLC Instruments. https://www.hplc.eu/Downloads/UHPLC_Guide.pdf.
- S. Kromidas, More Practical Problem Solving in HPLC (Wiley-VCH: Weinheim, Great Britain, 2005).
- M.C. McMaster, LC/MS: A Practical User’s Guide (John Wiley, Hoboken, New Jersey, 2005).
- M.C. McMaster, HPLC, A Practical User’s Guide, 2nd ed. (Wiley-Interscience, Hoboken, New Jersey, 2007).
- H. Small, in Ion Chromatography (Springer US, Boston, Massachusetts, 1989); p. 11–39. https://doi.org/10.1007/978-1-4899-2542-8_2.
- L.R. Snyder, J.J. Kirkland, and J.L. Glajch, Practical HPLC Method Development, 2nd ed. (Wiley, New York, New York, 1997).
- L.R. Snyder, J.J. Kirkland, and J.W. Dolan, Introduction to Modern Liquid Chromatography (John Wiley & Sons, Inc., Hoboken, New Jersey, 2009). https://doi.org/10.1002/9780470508183.
- "The use of Mobile Phase pH as a Method Development Tool," http://www.chromatographytoday.com/article/sample-prep/67/advanced-chromatography-technologies/the-use-of-mobile-phase-ph-as-a-method-development-tool/2693 (accessed Mar 15, 2021).
- "Chromatographic & Electrophoretic Methods" https://chem.libretexts.org/Courses/Northeastern_University/12%3A_Chromatographic_and_Electrophoretic_Methods (accessed Mar 15, 2021).
- PH, pKa, Ka, pKb, and Kb Explained - Advices - 2021 https://ph.leskanaris.com/4689-ph-pka-ka-pkb-and-kb-explained.html (accessed Mar 15, 2021).
- "Translate My Method," ACD/Labs.com, https://www.acdlabs.com/resources/freeware/translator/ (accessed Mar 15, 2021).
About the Columnist

PATRICIA ATKINS is a Senior Applications Scientist with Spex, an Antylia Scientific company and has been a member of many cannabis advisory committees and working groups for cannabis including NACRW, AOAC and ASTM.
How to Cite this Article
P. Atkins, Cannabis Science and Technology 4(3), 17-28 (2021).
Insights on Cannabis Testing Challenges and Industry Standards: An Interview with Douglas Duncan
August 9th 2024In light of recent headlines concerning cannabis laboratories throughout the country, Cannabis Science and Technology reached out to Douglas Duncan, Laboratory Director of Kairos Labs in Detroit, MI and member of our Editorial Advisory Board for more information. In this interview, Duncan shares his perspectives on lab shopping, major challenges in the industry today, and innovations in cannabis testing laboratories for the future. He also shares insights into consumer practices and the potential effects of a federal rescheduling of cannabis.