The Stability of Acid Phytocannabinoids Using Electrospray Ionization LC–MS in Positive and Negative Modes
This study highlights a potential concern for the quantitation of acid phytocannabinoids.
Figure 1: Decarboxylation of phytocannabinoids. THCA (top left) spontaneously decarboxylates to THC upon exposure to heat. Similarly, CBDA (lower left) spontaneously decarboxylates to CBD.
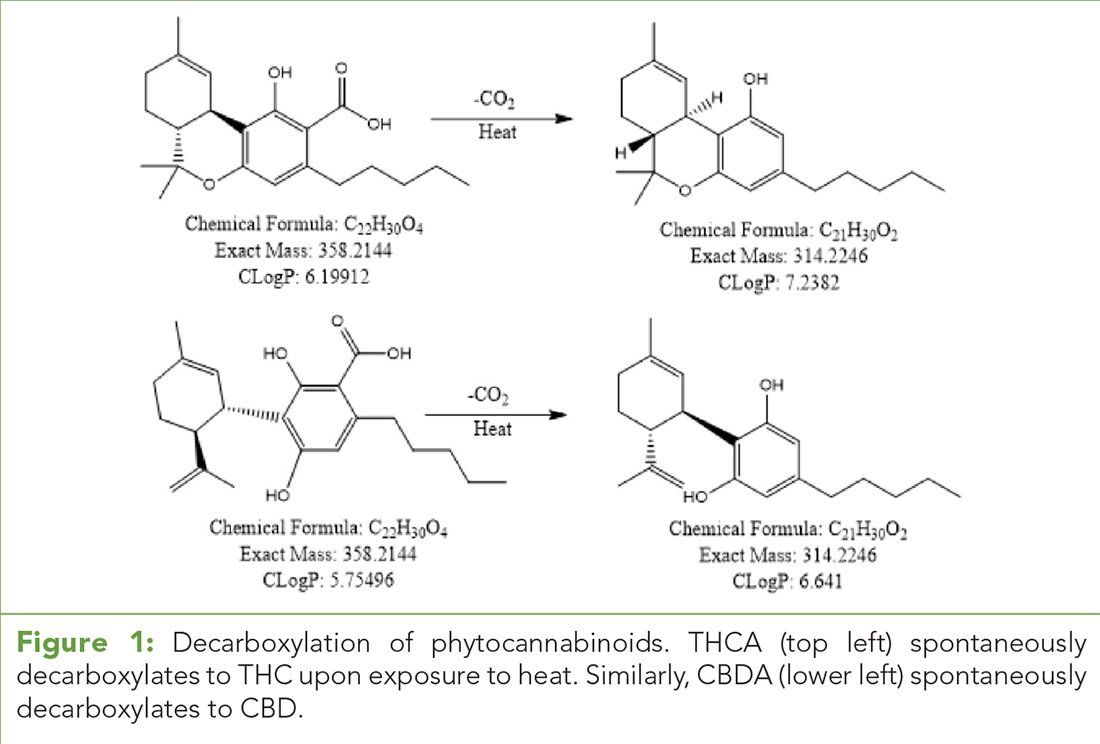
Table I: UHPLC mobile phases and quaternary gradient

Table II: LC-TOF parameters
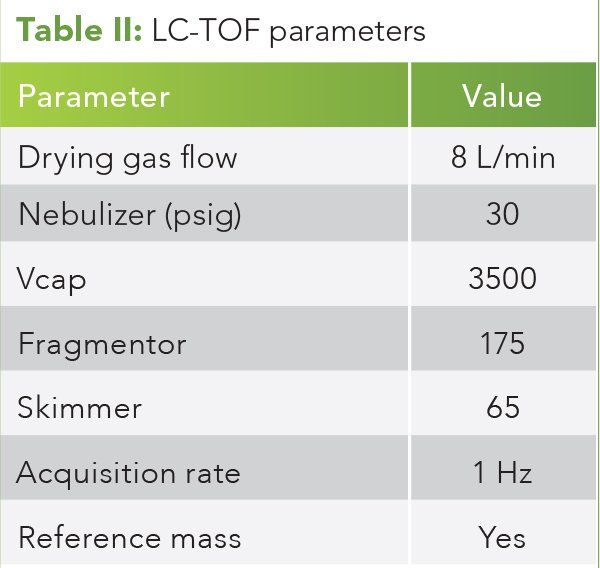
Figure 2: ESI+ mode and DAD chromatograms at 100 °C drying gas temperature. From top to bottom: EIC for CBD and THC, EIC for CBDA and THCA, and DAD signal at 230 nm. Note 230 nm discriminates against the noncarbonyl containing CBD and THC.
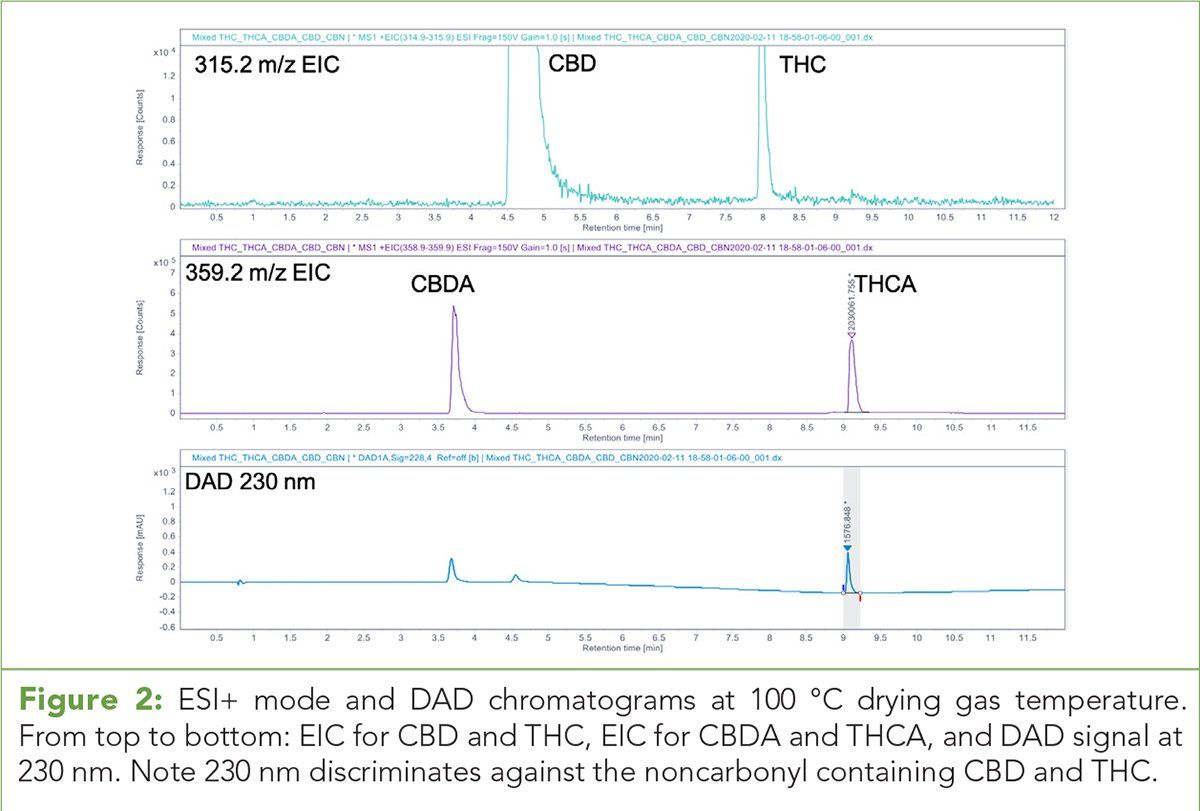
Figure 3: ESI+ mode and DAD chromatograms at 100 °C drying gas temperature. From top to bottom: EIC for CBD and THC, EIC for CBDA and THCA, and DAD signal at 230 nm.

Figure 4: ESI- EIC of THCA at 100 °C. Top, 315.2 EIC for THC. Bottom, 359.2 EIC for THCA.
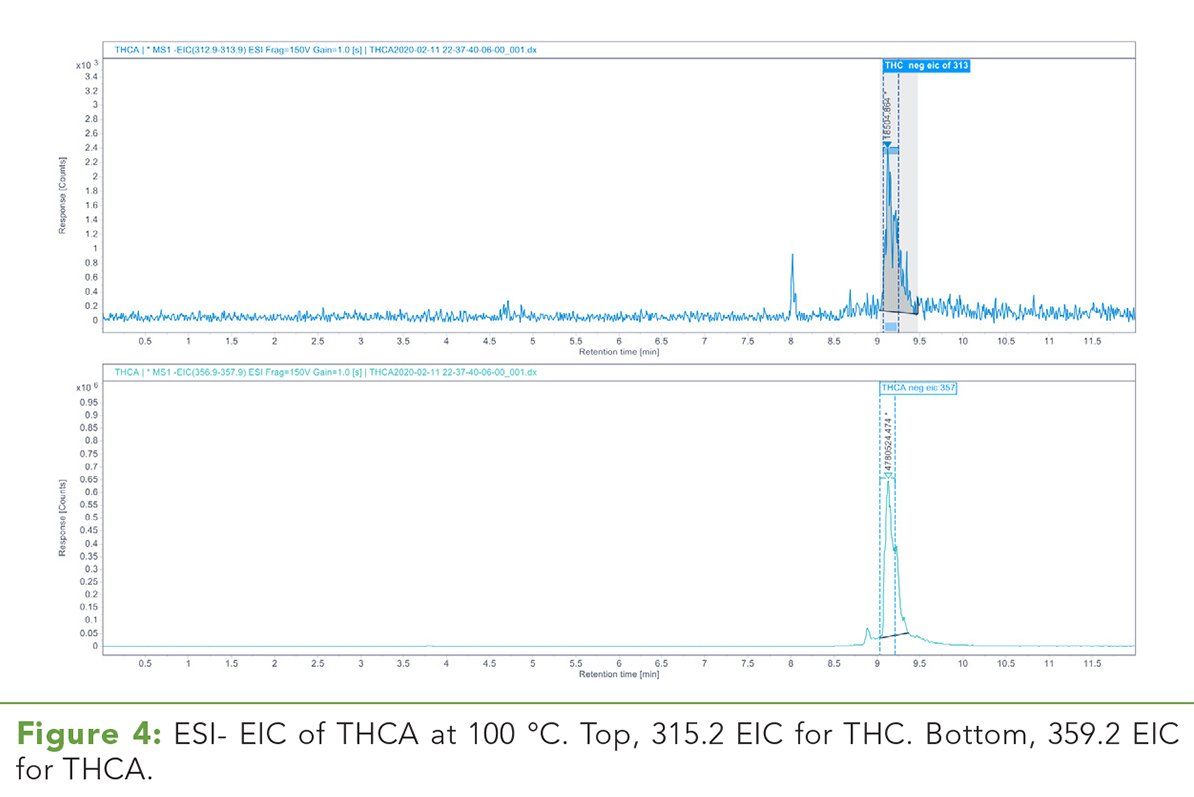
Figure 5: ESI- EIC of THCA at 300 °C. Top, 315.2 EIC for THC. Bottom, 359.2 EIC for THCA. Note the relative abundance of THC increases approximately 28-fold compared to the drying gas temperature at 100 ºC.
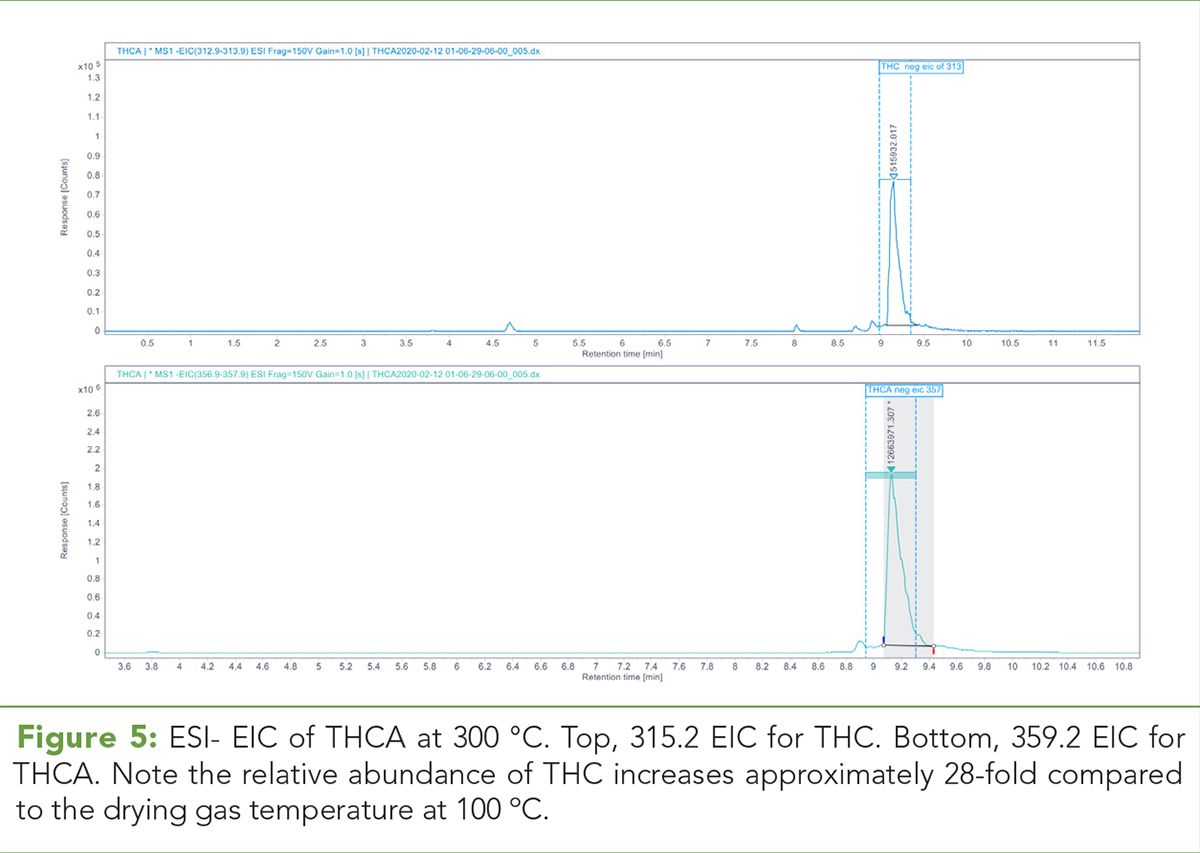
Table III: In ESI- mode, THCA and THC relative abundances and ratios each indicating a loss of THCA and an increase in THC abundance as the drying gas temperature is increased
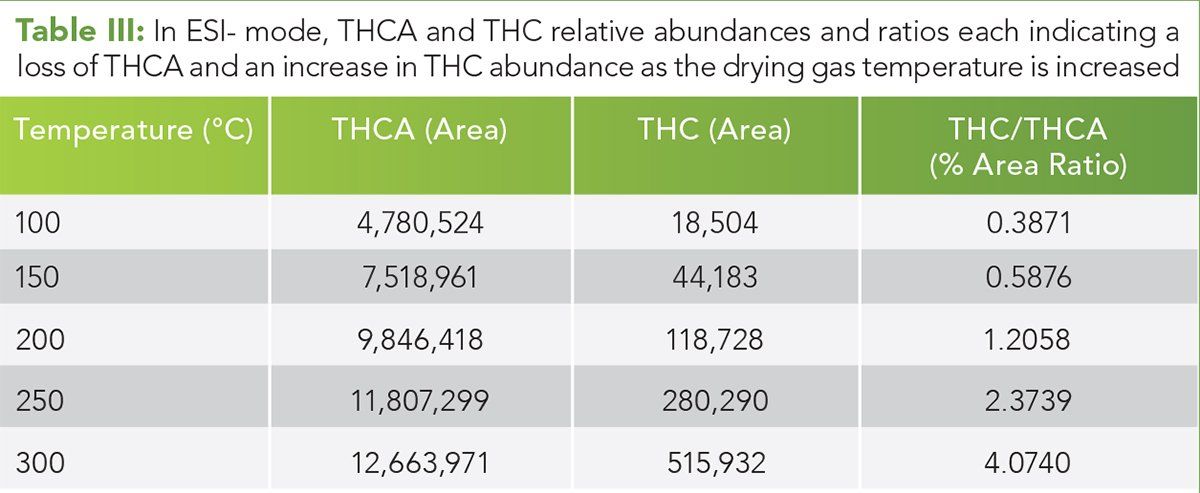
Figure 6: FIA HRAM spectrum over the mid temperature range. The mass accuracy for the (M+H)+ and (M+Na)+ ions indicative of THCA is < 1 ppm, and the MFG score is 99.74. The red outline is the predicted isotope ratio. The empirical isotopic ratios and spacing data agree extremely well theoretical prediction.
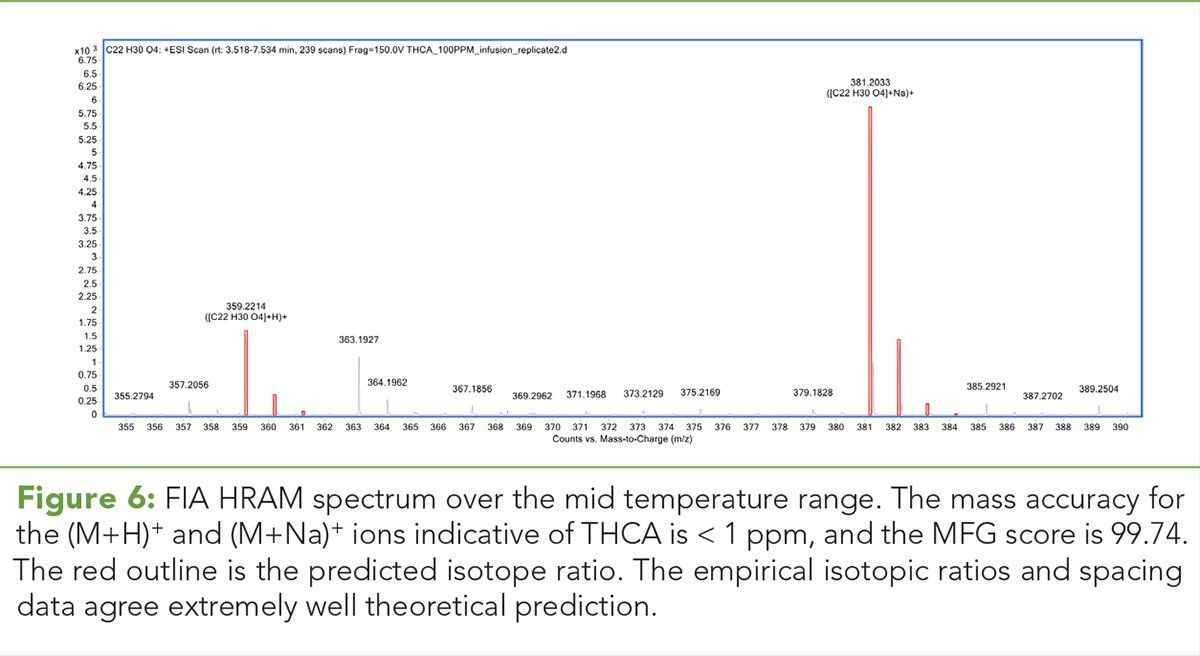
Figure 7: FIA HRAM spectrum over the mid temperature range. The mass accuracy for the (M+H)+ ion indicative of THC is > 5 ppm, and MFG score is 58.43 and the red outline is the predicted isotope ratio. Although the empirical isotopic ratios and spacing agree well theoretical predictions and the correct chemical species is generated, a poor mass accuracy is a result of poor ion statistics at this low ion abundance.
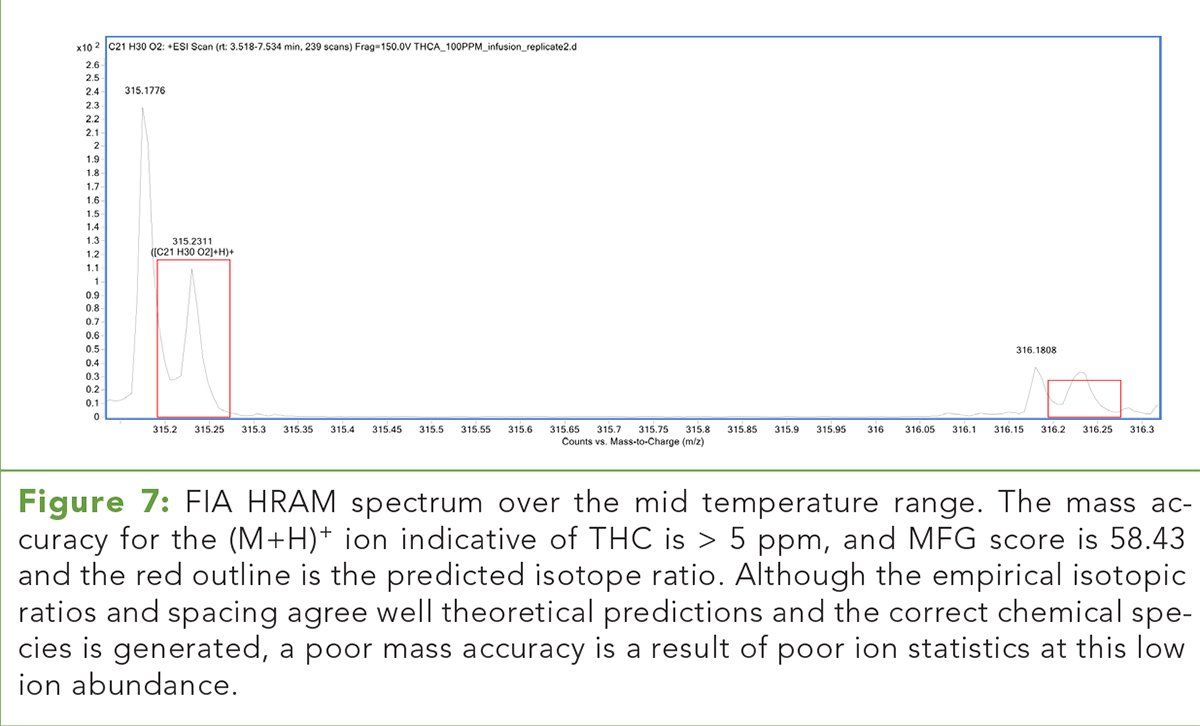
Table IV: FIA HRAM relative ion abundances for each observed chemical species. Decreasing THC/THCA ion ratios indicate THCA is relatively stable in ESI+ mode up to 350 ºC.

Figure 8: HRAM EICs for CBDA decarboxylation in ESI- mode. Each temperature is paired as A and B, where A is the exact mass of CBD (313.2173 m/z), and B is the is the exact mass of CBDA (357.2071).
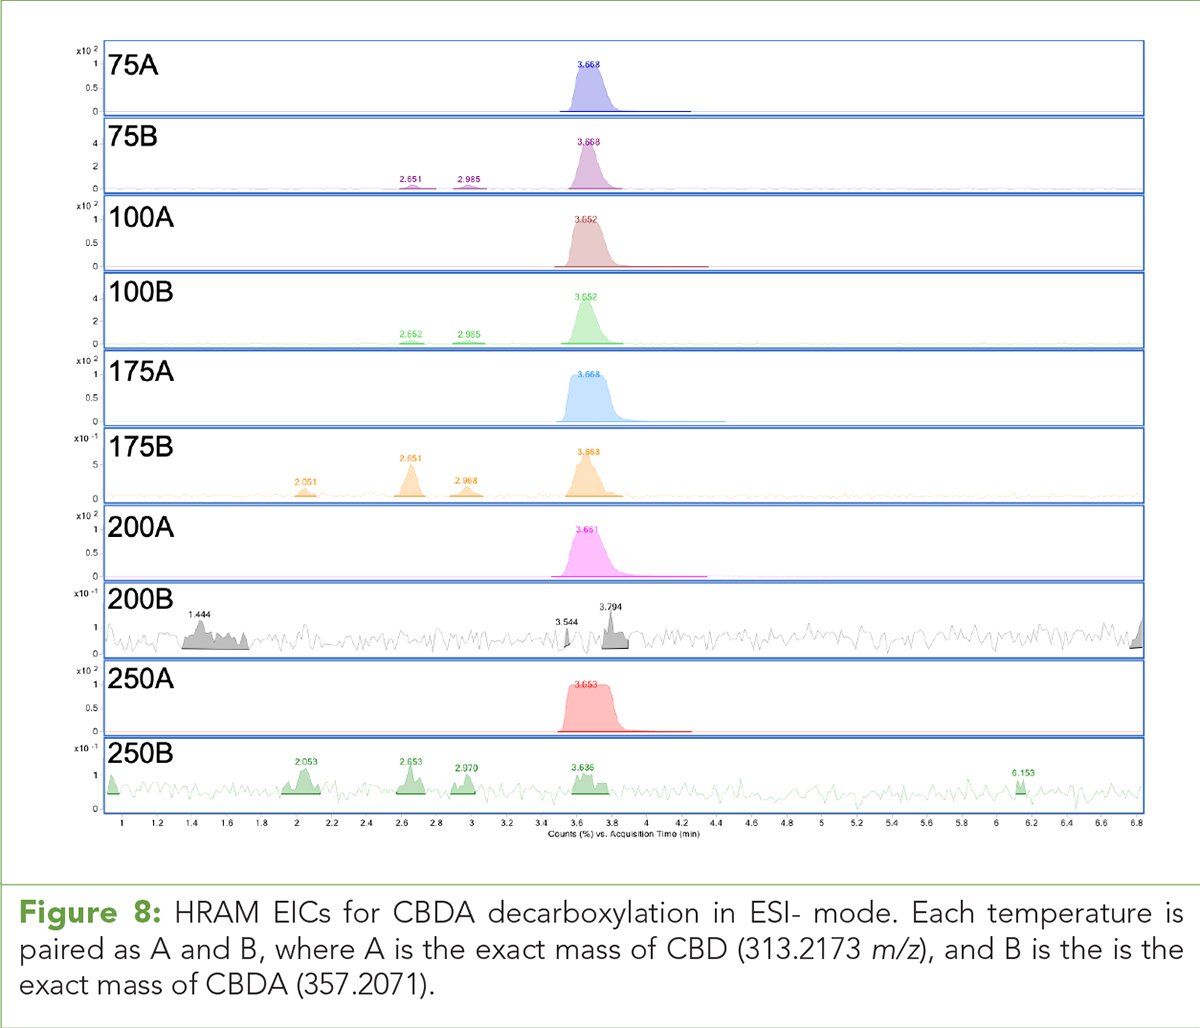
Figure 9: HRAM EICs for THCA decarboxylation in ESI- mode. Each temperature is paired as A and B, where A is the exact mass of THC (313.2173 m/z), and B is the is the exact mass of THCA (357.2071).

Figure 10: ESI+ mode (M+H)+ pseudomolecular ion for THC.
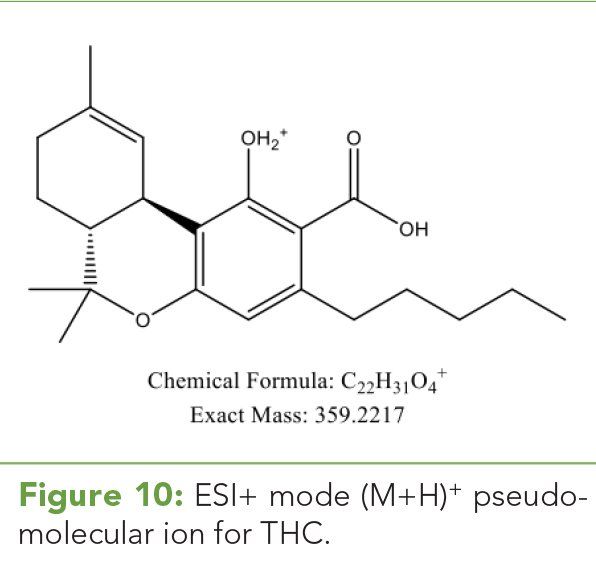
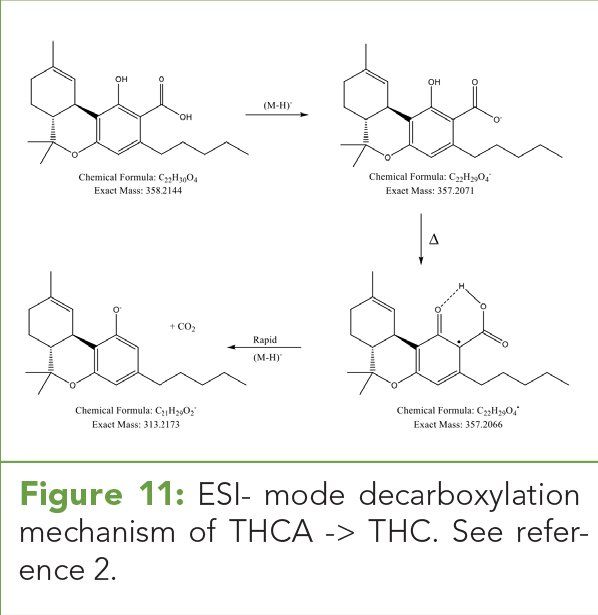
Figure 11: ESI- mode decarboxylation mechanism of THCA -> THC. See reference 2.
In this study, we evaluated the stability of carboxylated phytocannabinoids analyzed with positive and negative electrospray (ESI+ and ESI-, respectively) liquid chromatography–mass spectrometry (LC–MS) as a function of drying gas temperature. We used both chromatographic and flow injection analysis (FIA) conditions. Post-chromatographic (in-source) acid decarboxylation was not observed over a drying gas temperature range of 75 °C through 300 °C in ESI+ mode under chromatographic conditions. FIA experiments further demonstrated no correlation between in-source acid decarboxylation in ESI+ mode over a drying gas temperature range of 100 °C through 350 °C. Conversely, chromatographic experiments in ESI- mode did reveal a decrease in tetrahydrocannabinolic acid (THCA) and cannabidiolic acid (CBDA) relative abundances and concomitant increases in the relative abundances of tetrahydrocannabinol (THC) and cannabidiol (CBD) as a function of drying gas temperatures. These data highlight a potential concern for the quantitation of acid phytocannabinoids using ESI- mode LC–MS technologies
The Cannabis spp. genome encodes synthase enzymes (1) for the synthesis of carboxylated phytocannabinoids such as Î9-tetrahydrocannabinolic acid (THCA), cannabidiolic acid (CBDA), and cannabigerolic acid (CBGA). In the living plant, psychoactive Î9-tetrahydrocannabinol (THC) does not exist at significant concentrations nor does cannabidiol (CBD)-another cannabinoid that has garnered interest in recent years. THC and CBD are formed through decarboxylation of THCA and CBDA, respectively, through exposure to light, heat, and curing processes (2). Figure 1 illustrates the acid to neutral decarboxylation of THCA and CBDA. The reaction order, ko, and the activation energy (EA) of acid -> neutral decarboxylation has been determined over specific temperatures and times in C. sativa flowering buds (3). Chemical testing can also influence cannabinoid acid decarboxylation if the testing system exposes the sample to heat (4) as in the injection port of a gas chromatography (GC) system. Liquid chromatography–mass spectrometry (LC–MS) systems also expose the acid phytocannabinoids to heat in the electrospray ionization (ESI) source region. To our knowledge, the effect on acid decarboxylation as a function of temperature in the ESI source region has not been reported. In fact, a PubMed query of “phytocannabinoid decarboxylation in the ESI source” and related queries yielded zero results. One study evaluated the changes in chemical profiles of extracts at ambient temperature versus decarboxylation at a series of temperature ranges (5). Our study used ESI LC–MS in both positive and negative modes to determine the effect of electrospray source temperature on the stability of acid phytocannabinoids in neat solutions. (See upper right for Figure 1, click to enlarge.)
Experimental
We make the following assumption: under the conditions of a high performance liquid chromatography (HPLC) method, decarboxylation is mitigated and acid phytocannabinoids are stable under the time frame of the analysis as they transport across the column stationary phase. The null hypothesis states the acid phytocannabinoids are equally stable and remain relatively unchanged in the ESI source. To reject the null hypothesis, we must observe a decrease in the relative abundance of the carboxylated species with a commensurate increase in the relative abundance of the decarboxylated analogues. To make this determination, we used electrospray ionization in both positive and negative modes under chromatographic and flow injection analysis (FIA) conditions. In the various experiments, the drying gas temperature was varied from 75 °C through 350 °C and we monitored (M+H)+ and (M-H)- pseudomolecular ions and (M+Na)+ adducts specific to the carboxylated and decarboxylated chemical species.
Standards and Reagents
THCA, THC, CBDA, and CBD were obtained from Cerilliant. All cannabinoid reference standards were obtained in U.S. Drug Enforcement Administration (DEA) exempt format at 1.0 mg/mL in organic solvent. LC–MS grade methanol, acetonitrile, and formic acid were obtained from Agilent Technologies. Millipore de-ionized (DI) water was used for the aqueous mobile phase.
Analytical InstrumentationLow Resolution LC–MS Experiments
An LC–MS system (Agilent Technologies) equipped with a diode array detector (DAD) and a nebulizer ESI source was used. The mass spectrometer was operated in ESI+ and ESI- modes over the mass range of 100–500 m/z. For each experiment, the drying gas temperatures were 100 °C, 150 °C, 200 °C, 250 °C, and 300 °C. The LC–MS conditions are shown below.
LC Conditions:
Column: Agilent InfinityLab Poroshell 120 EC-C18, 3.0 × 50 mm, 2.7 μm
Mobile Phase: A) 0.1% (V/V) formic acid aqueous phase; B) 0.05% (V/V) formic acid organic phase
Flow rate: 1.0 mL/min
Column temperature: 50 °C
Injection volume: 5 µL
Diode array detector: 230 nm and 270 nm
iQ LC/MSD Parameters:
Drying gas flow: 13 L/min
Nebulizer: 55 psig
Vcap: 3500
LC Mobile Phase Gradient:
Time (min) %B
0 60
1.0 60
7.0 70
8.2 95
High Resolution Accurate Mass (HRAM) FIA Experiments
A quadrupole time-of-flight (QTOF) mass spectrometer (Agilent Technologies) equipped with a dual ESI source was used. The QTOF was operated in ESI+ mode over the mass range of 100–500 m/z. Samples were directly infused into the electrospray source with a syringe pump at a rate of 200 µL/h. The drying gas temperature was incremented stepwise at 50 °C intervals from 100 °C through 350 °C. The QTOF parameters and drying gas temperature program are shown below.
QTOF LC–MS Parameters:
Drying gas flow: 12 L/min
Nebulizer:30 psig
Vcap: 4000
Fragmentor: 150
Skimmer: 65
Acquisition rate: 1 Hz
Drying Gas Temperature Program:
0.0 to 1.5 min, Hold 100 °C
1.5 to 2.5 min, Gradient to 150 °C
2.5 to 3.5 min, Hold 150 °C
3.5 to 4.5 min, Gradient to 200 °C
4.5 to 5.5 min, Hold 200 °C
5.5 to 6.5 min, Gradient to 250 °C
6.5 to 7.5 min, Hold 250 °C
7.5 to 8.5 min, Gradient to 300 °C
8.5 to 9.5 min, Hold 300 °C
9.5 to 10.5 min, Gradient to 350 °C
10.5 to 11.5 min, Hold 350 °C
HRAM Chromatographic Confirmation Experiments
An ultrahigh-pressure liquid chromatography (UHPLC) system and time-of-flight (LC/TOF) mass spectrometer (Agilent Technologies) equipped with a dual ESI source was used. The column was an Agilent Poroshell 120 EC-18 3.0 mm x 50.0 mm, 2.7 µm particle size (PN 699975-302). The flow rate was 0.5 mL/min. The injection volume was 5 µL. The TOF mass spectrometer was operated in ESI- mode over the mass range of 100–1000 m/z with reference mass on. For each experiment, the drying gas temperatures were 75 °C, 100 °C, 175 °C, 200 °C, and 250 °C. The LC/TOF conditions are given in Tables I and II. (See upper right for Table I and Table II, click to enlarge.)
Sample PreparationLow Resolution LC–MS Confirmatory Experiments
For the ESI+ mode experiments, solvent standards containing CBDA, CBD, TCHA, and THCA were prepared at 250 µg/mL in acetonitrile. For the ESI- mode experiments, a solvent standard containing THCA was prepared at 500 µg/mL in LC–MS grade acetonitrile.
HRAM FIA Experiments
A 100 µg/mL solution of THCA was prepared in LC–MS grade acetonitrile.
HRAM Chromatographic Confirmation Experiments
A solvent standard containing CBDA and THCA was prepared at 500 µg/mL in LC–MS grade acetonitrile.
Results
Low Resolution LC–MS Experiments
In ESI+ mode, CBDA, CBD, THC, and THCA are observed at the proper retention times and the DAD signal remains relatively constant over the five injections of increasing drying gas temperature. No CBD or THC are observed under the CBDA or THCA peaks at any drying gas temperature. Figures 2 and 3 illustrate the ESI+ mode LC–MS and DAD chromatograms at 100 °C and 300 °C, respectively. (See upper right for Figures 2 and 3, click to enlarge.)
In ESI- mode, there is an inverse correlation between the relative abundance of THCA and drying gas temperature while the relative THC abundance is positively correlated with increasing drying gas temperature. Figures 4 and 5 illustrate the 359.2 m/z and 315.3 m/z ESI-extracted-ion chromatograms (EICs) for THCA and THC at 100 °C and 300 °C, respectively. (See upper right for Figures 4 and 5, click to enlarge.) Table III demonstrates the absolute area counts and relative ratios for the loss of THCA and the increase of THC as the temperature of the drying gas is increased. (See upper right for Table III, click to enlarge.)
HRAM FIA Experiments
The FIA temperature program was bracketed into three regions:
1. Low temperature range: 0.0 min to 3.5 min, 100–150 °C
2. Mid temperature range: 3.5 min to 7.5 min, 150–250 °C
3. High temperature range: 7.5 min to 11.5 min, 250–350 °C
FIA high resolution accurate mass EIC chromatograms specific for THCA and THC were extracted within each region. In this study, the THCA (M+H)+ pseudomolecular ion and (M+Na)+ adduct were observed with exact masses of 359.2217 m/z and 381.2036 m/z, respectively. THC was observed as the (M+H)+ pseudomolecular ion at 315.2319 m/z. The mass accuracy, molecular formula generation (MFG) from the empirical spectra, and the isotopic fidelity were measured for each chemical species. These data are shown in Figures 6 and 7 for the mid-temperature range of 150–250 °C. (See upper right for Figure 6 and Figure 7, click to enlarge.)
Table IV illustrates the relative HRAM EIC ion abundance for each chemical species representing THCA and THC and their respective ion ratios. In FIA ESI+, the decreasing THC/THCA ion ratios reveal the fact that little to no acid phytocannabinoid decarboxylation is occurring under these conditions. This suggests the ESI+ pseudomolecular ion of THCA is relatively stable and does not undergo significant decarboxylation over the temperature range of 100 °C through 350 °C. (See upper right for Table IV, click to enlarge.)
HRAM Chromatographic Confirmation Experiments
In ESI negative mode, THCA is observed at the proper retention time and THC is observed under the THCA peak at all drying gas temperatures. The relative abundance of the acid is reduced with commensurate increase in the relative abundance of THC as the drying gas temperature is increased from 75 °C through 250 °C with complete loss of the acid compounds at 200 °C and 250 °C for CBDA and THCA, respectively. Figure 8 is the series of HRAM EICs representing CBDA and CBA over the drying gas temperature range of 75°C through 250°C. Figure 9 is the series of HRAM EICs representing THCA and THC over the drying gas temperature range of 75 °C through 250 °C. In both cases, the relative abundance of the acid phytocannabinoids is reduced while the relative abundance of the decarboxylated analogues CBD and THC are increased as the drying gas temperature is increased. This is evidence of in-source decarboxylation of the acid phytocannabinoid. (See upper right for Figures 8 and 9, click to enlarge.)
Discussion
In this study, we used TOF, QTOF, and single quadrupole LC–MS systems in ESI+ and ESI- modes to evaluate the effect of temperature in the source region on the stability of acid phytocannabinoids. We initially used a chromatographic approach with a single quadrupole LC–MS coupled with a diode array detector. Under these conditions, we putatively determined that no decarboxylation of the acid phytocannabinoids THCA and CBDA occurs over the drying gas temperature range of 100 °C through 300 °C in ESI+ mode. However, under the same chromatographic conditions and temperature range, the in-source loss of the relative abundance of THCA with commensurate increase of the relative abundance of THC was observed. The increase in the percent area ratio of THC/THCA taken from Table III is exponential.
We next used FIA on a LC-QTOF system in ESI+ mode to remove any effects of chromatography and confirm the absence of THCA decarboxylation under these conditions. Lastly, using a LC-TOF system with chromatography in ESI- mode we injected a mixture of CBDA and THCA over the temperature range 75 °C through 250 °C. Through this experiment, we confirmed post-chromatographic, in-source decarboxylation of the acid cannabinoids as evidenced by the observation of CBD and THC under the CBDA and THCA chromatographic peaks. Under these conditions, complete loss of the acid cannabinoids is observed at 200 °C and 250 °C for CBDA and THCA, respectively. This observation agrees with data from reference 3.
Given these observations, we propose the (M+H)+ pseudomolecular ions and (M+Na)+ adducts of acid phytocannabinoids are stable in ESI+ mode and the energetics of decarboxylation are not favorable under these conditions. Figure 10 illustrates the putative (M+H)+ pseudomolecular ion for THC. Conversely in ESI- mode, the (M-H)- species readily decarboxylates as a function of drying gas temperature in the source through the mechanism shown in Figure 11. (See upper right for Figures 10 and 11, click to enlarge.)
Conclusion
With chromatography, the mass spectral detection of CBD or THC under the chromatographic CBDA and THCA peaks, respectively, confirms post-chromatographic decarboxylation in the source region. When using ESI+ with chromatographic or FIA conditions, decarboxylation of the acids are not observed. However, ESI- mass spectra data reveal the acid phytocannabinoid decarboxylation exponentially increases as the drying gas temperature of the ESI source is increased. We therefore reject the null hypothesis for ESI- LC–MS analyses and posit acid phytocannabinoids fully decarboxylate in ESI- mode with source temperatures ≥ 200 °C. These data highlight a potential concern for the quantitation of acid phytocannabinoids using ESI- mode LC–MS technologies.
Disclaimer
Agilent products and solutions are intended to be used for cannabis quality control and safety testing in laboratories where such use is permitted under state or country law.
References:
- H. van Bakel, et al., Genome Biol.12, R102 (2011).
- H. Perrotin-Brunel, et al., J. Molecular Structure987, 67–73 (2011).
- M. Wang, et al., Cannabis and Cannabinoid Research1.1, 262–271 (2016).
- C. Lanz, et al., PLoS One11(1), e0147286 (2016).
- M.M. Lewis, et al., ACS Omega2, 6091−6103 (2017).
Peter J.W. Stone, Sue D’Antonio, Nikolas C. Lau, and Wendi A. Hale are with Agilent Technologies in Santa Clara, California. Anthony Macherone is with Agilent Technologies and The Johns Hopkins School of Medicine in Baltimore, Maryland. Direct correspondence to: anthony_macherone@agilent.com
How to Cite this Article
P.J.W. Stone, S. D’Antonio, N.C. Lau, W.A. Hale, and A. Macherone, Cannabis Science and Technology3(3), 34–40 (2020).
